Debugging & Production Troubleshooting
Diagrams
Concepts
Systematic Debugging
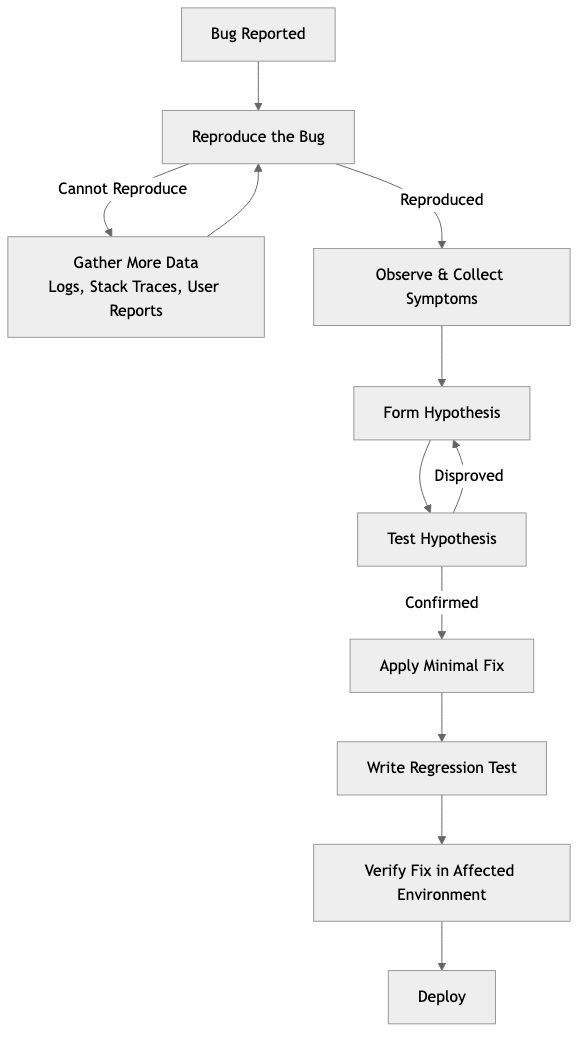
Debugging is not random guessing. It's a systematic process of forming hypotheses and testing them. The best debuggers follow a method:
The Scientific Method for Debugging:
- Reproduce — Can you reliably trigger the bug? If not, gather more data (logs, user reports, stack traces). A bug you can't reproduce is a bug you can't confidently fix.
- Observe — What exactly happens? What should happen instead? Gather symptoms: error messages, logs, stack traces, timing, affected users.
- Hypothesize — What could cause this behavior? List possible causes, ranked by likelihood.
- Test — Verify or eliminate each hypothesis. Change one thing at a time.
- Fix — Apply the minimal fix. Write a test that reproduces the bug to prevent regression.
- Verify — Confirm the fix in the environment where the bug occurred.
The most common debugging mistake: Jumping to a solution before understanding the problem. Engineers often change code based on a hunch, test it, find the bug persists, and repeat — wasting hours. The discipline is: understand first, fix second.
Narrowing the Search Space
When facing a bug, your first goal is to reduce the search space — the amount of code that could contain the problem.
Techniques:
| Technique | How it works | |-----------|-------------| | Binary search (git bisect) | Find the commit that introduced the bug by bisecting the history | | Divide and conquer | Comment out half the system. Does the bug still occur? Narrow to the half that matters. | | Minimal reproduction | Strip away everything until you have the smallest code that still triggers the bug | | Input reduction | If a specific input causes the bug, reduce the input to the minimal triggering case | | Rubber duck debugging | Explain the code line-by-line to someone (or a rubber duck). The act of explaining often reveals the flaw. |
git bisect example:
# Start bisecting
git bisect start

# Mark current commit as bad (has the bug)
git bisect bad

# Mark a known good commit (didn't have the bug)
git bisect good v1.2.0

# Git checks out a commit in the middle
# Test it, then tell git:
git bisect good  # or git bisect bad

# Repeat until git identifies the exact commit
# Automate with a test script:
git bisect run cargo test -- test_that_catches_the_bug
Debuggers
A debugger lets you pause execution, inspect variables, step through code line by line, and examine the call stack.
LLDB/GDB with Rust:
# Build with debug symbols
cargo build

# Start debugging
rust-lldb target/debug/my_app

# Or with GDB
rust-gdb target/debug/my_app
Essential debugger commands (LLDB):
| Command | Purpose |
|---------|---------|
| b main | Set breakpoint at function main |
| b src/server.rs:42 | Set breakpoint at file:line |
| r | Run the program |
| n | Step over (next line) |
| s | Step into (enter function call) |
| c | Continue until next breakpoint |
| p variable_name | Print a variable's value |
| bt | Show backtrace (call stack) |
| frame variable | Show all local variables |
| watch variable | Break when variable changes |
When to use a debugger vs println!:
- Debugger: Complex state, need to inspect multiple variables, stepping through logic, examining call stacks
println!/ logging: Quick checks, concurrent code (debuggers struggle with async), production debugging
Logging Strategies
Logging is often the primary debugging tool, especially in production where you can't attach a debugger.
Log levels and when to use them:
| Level | Purpose | Example | |-------|---------|---------| | ERROR | Something failed and requires attention | "Payment processing failed for order #123" | | WARN | Something unexpected but the system recovered | "Retry succeeded after 2 failures for service X" | | INFO | Normal operations worth recording | "User alice@example.com logged in" | | DEBUG | Detailed information useful during development | "Query returned 42 rows in 15ms" | | TRACE | Very detailed, step-by-step execution | "Entering function calculate_tax with amount=100.0" |
Structured logging:
Structured logs (JSON format) are searchable, parseable, and queryable — unlike unstructured text logs.
// Instrumented for tracing
ASYNC FUNCTION PROCESS_ORDER(order_id: unsigned integer, pool: PgPool) -> void or OrderError
    LOG INFO order_id, "Processing order"

    MATCH CHARGE_PAYMENT(order_id, pool)
        CASE Ok(transaction_id):
            LOG INFO order_id, transaction_id, "Payment successful"
            RETURN Ok
        CASE Err(e):
            LOG ERROR order_id, error: e, "Payment failed"
            RETURN Err(e)
Output (structured JSON):
{"timestamp":"2024-03-15T10:30:00Z","level":"INFO","order_id":456,"message":"Processing order","span":"process_order"}
{"timestamp":"2024-03-15T10:30:01Z","level":"ERROR","order_id":456,"error":"card declined","message":"Payment failed","span":"process_order"}
Logging rules:
- Log at boundaries (API entry, database calls, external service calls)
- Include correlation IDs (request ID, user ID) so you can trace a request across services
- Never log sensitive data (passwords, tokens, PII)
- Log the why, not just the what: "Payment failed: card expired" not just "Payment failed"
CPU Profiling & Flamegraphs
When something is slow, profiling tells you where the time is spent.
CPU profiling samples the call stack at regular intervals and counts how often each function appears. Functions that appear frequently are where the CPU spends the most time.
Flamegraphs visualize profiling data. Each horizontal bar is a function, and its width represents the time spent. The vertical axis shows the call stack.
┌──────────────────────────────────────────────────┐
│ main                                              │
├────────────────────────┬─────────────────────────┤
│ handle_request         │ background_task          │
├──────────┬─────────────┤                         │
│ parse_json│ query_db    │                         │
│          ├──────┬──────┤                         │
│          │ conn │ exec  │                         │
└──────────┴──────┴──────┴─────────────────────────┘
In this flamegraph, query_db is the widest bar under handle_request, suggesting database queries are the bottleneck.
Using cargo-flamegraph:
# Install
cargo install flamegraph

# Generate a flamegraph
cargo flamegraph --bin my_app

# Opens flamegraph.svg in your browser
Memory Profiling
Memory issues manifest as:
- Memory leaks — Memory usage grows without bound, eventually crashing the process
- Excessive allocation — Too many heap allocations slow things down (allocator pressure)
- Cache misses — Data layout causes CPU cache inefficiency
Tools for Rust:
| Tool | Purpose | |------|---------| | Valgrind (Memcheck) | Detect memory leaks, use-after-free, uninitialized memory | | DHAT | Heap profiling — what's being allocated, where, and how much | | heaptrack | Track heap allocations over time | | perf | Low-level CPU and memory profiling on Linux | | Instruments | macOS profiling suite (part of Xcode) |
# Run with valgrind
valgrind --leak-check=full target/debug/my_app

# Using DHAT with Rust
cargo install dhat
# Add dhat as a dependency and use #[global_allocator]
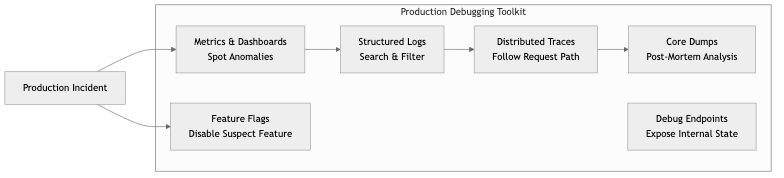
Debugging in Production
Production debugging is fundamentally different from local debugging:
- You can't attach a debugger to a production server (usually)
- You can't add
println!and redeploy (too slow) - The bug might only occur under real load or with real data
- You're under time pressure because users are affected
Production debugging toolkit:
| Tool | Purpose | |------|---------| | Structured logs | Search for patterns across millions of log lines | | Distributed tracing | Follow a single request across multiple services | | Metrics & dashboards | Spot anomalies (latency spikes, error rate increases) | | Core dumps | Post-mortem analysis of a crashed process | | Feature flags | Disable a suspected feature without deploying | | Debug endpoints | Expose internal state (connection pool status, cache hit rates) — behind auth | | Log level escalation | Temporarily increase log verbosity for a specific component |
Core dumps:
When a process crashes, the OS can save its memory state to a file (core dump). You can analyze this post-mortem:
# Enable core dumps
ulimit -c unlimited

# When it crashes, analyze with GDB/LLDB
rust-gdb target/release/my_app core.12345

# In GDB:
(gdb) bt          # Backtrace — see where it crashed
(gdb) frame 3     # Jump to a specific stack frame
(gdb) info locals  # See local variables at crash point
Tracing in production:
Distributed tracing (OpenTelemetry) attaches a trace ID to every request and propagates it across service boundaries. When a user reports "my request was slow," you can search for that trace ID and see exactly which service was the bottleneck.
Business Value
- Reduced Mean Time to Resolution (MTTR): Systematic debugging with good tooling reduces incident resolution from hours to minutes. At 100,000/hour downtime cost, this directly saves money.
- Faster development velocity: Developers who can debug efficiently spend more time building features. A team that can find bugs in minutes vs hours ships noticeably faster.
- Production stability: Proactive profiling catches performance regressions before they become incidents. Memory leak detection in staging prevents production crashes.
- Knowledge transfer: Documented debugging techniques and runbooks mean any engineer can investigate issues, not just the original author.
Real-World Examples
Facebook's Scuba (Real-Time Debugging)
Facebook built Scuba, a system for querying billions of log events in real time. When something goes wrong, engineers can interactively slice data by time, region, user segment, or error type — getting answers in seconds. This capability transforms debugging from "search through log files" to "ask questions and get instant answers." It's a key reason Facebook maintains high availability despite enormous scale.
Brendan Gregg's Flamegraphs at Netflix
Brendan Gregg (at Netflix) popularized flamegraphs as a profiling visualization. Netflix uses them extensively to find performance bottlenecks across their microservices. In one case, a flamegraph revealed that a common utility function was performing unnecessary string copies — fixing it saved significant CPU across thousands of instances. The flamegraph made the problem visible in seconds; without it, the bottleneck would have been invisible.
Cloudflare's Production Debugging Culture
Cloudflare processes millions of requests per second. Their debugging culture emphasizes: structured logging with request IDs, distributed tracing across their edge network, and "observability as code" (dashboards and alerts defined in code, not clicked together in a UI). When an incident occurs, any engineer can pull up a request trace and see exactly where it failed — without needing tribal knowledge.
How Stripe Debugs Payment Failures
Stripe's debugging workflow for payment failures: every API request gets a unique request ID, logged with full context (merchant, amount, payment method, processor response). When a merchant reports a failure, support looks up the request ID and sees the complete chain of events. This takes seconds, not hours. They also built internal tools that let engineers replay failed requests against test environments to reproduce issues safely.
Common Mistakes & Pitfalls
-
Debugging by random changes — Changing code randomly and hoping the bug disappears. If you can't explain why a change fixes the bug, you haven't actually fixed it.
-
Ignoring the stack trace — Stack traces tell you exactly where the error occurred and the chain of calls that led there. Read them top-to-bottom (in Rust, bottom-to-top for the call chain).
-
Insufficient logging — "The system crashed but we have no idea why because we don't log anything." Add logging at boundaries before you need it.
-
Over-logging — Logging everything generates noise that makes finding the signal impossible. Log meaningfully at the right levels.
-
Not reproducing before fixing — Guessing at a fix without reproducing the bug. You might fix a different bug or create a new one.
-
Premature optimization — "I think this function is slow" without profiling. Profile first, optimize what the data tells you is slow.
-
Debugging production without a safety net — Making changes to production without the ability to roll back. Always have a rollback plan.
Trade-offs
| Approach | Pros | Cons | |----------|------|------| | Printf debugging | Simple, works everywhere, easy to understand | Requires recompilation, no interaction | | Interactive debugger | Full inspection, step through logic | Awkward with async/concurrent code, not for production | | Structured logging | Searchable, queryable, works in production | Requires upfront investment, storage costs | | Distributed tracing | Follow requests across services | Complex setup, sampling trade-offs, overhead | | Profiling | Data-driven performance insights | Adds overhead, requires interpretation skill |
When to Use / When Not to Use
Debugger — use for:
- Complex state that's hard to reason about by reading code
- Stepping through unfamiliar code to understand control flow
- Inspecting values at specific points in execution
- Post-mortem analysis of core dumps
Printf / logging — use for:
- Quick verification of a hypothesis
- Concurrent and async code where debuggers struggle
- Production debugging (always structured logs)
Profiling — use for:
- "It's slow" without knowing why
- Before and after optimization to verify improvement
- Regular performance regression checks in CI
git bisect — use for:
- "It used to work" — finding exactly when it broke
- Regressions that are hard to pin to a specific change
Key Takeaways
- Debugging is a systematic process: reproduce → observe → hypothesize → test → fix → verify. Resist the urge to guess.
git bisectis underused. It can find the exact breaking commit in O(log n) steps.- Structured logging is a prerequisite for production debugging. Invest in it early.
- Flamegraphs make performance bottlenecks visible at a glance. Profile before optimizing.
- Production debugging requires different tools than local debugging: logs, traces, metrics, and core dumps replace breakpoints and
println!. - Memory profiling catches leaks before they cause production crashes. Run soak tests with profiling enabled.
- Every bug fix should include a test that would have caught the bug. This prevents regressions.
Further Reading
-
Books:
- Debugging — David J. Agans (2002) — Nine practical rules for systematic debugging
- Systems Performance — Brendan Gregg (2nd edition, 2020) — The definitive guide to performance analysis and profiling
-
Papers & Articles:
- Flamegraph Documentation — Brendan Gregg's comprehensive guide
- Debugging Rust with GDB/LLDB — Rust compiler dev guide
- The Art of Debugging — Julia Evans' collection of debugging resources
-
Tools:
- cargo-flamegraph — Generate flamegraphs for Rust programs
- tokio-console — Debugger for async Rust (tokio)
- tracing — Structured logging and tracing for Rust
- Valgrind — Memory debugging and profiling