
Design a Real-Time Analytics Pipeline
Overview
A real-time analytics pipeline ingests, processes, and serves event data for dashboards, reports, and behavioral analysis. Systems like Segment, Mixpanel, and Amplitude handle billions of events daily from web, mobile, and server sources. The core challenge is maintaining low-latency query performance over massive event volumes while handling late-arriving data and ensuring exactly-once processing semantics.
Functional Requirements
Core capabilities:
  - Ingest events from multiple sources (web SDKs, mobile SDKs, server APIs)
  - Process events in real-time for live dashboards
  - Run batch aggregations for historical analysis
  - Store raw events in a data warehouse for ad-hoc queries
  - Pre-compute common aggregations (counts, uniques, funnels)
  - Handle late-arriving events with correct attribution
  - Support user-defined custom events and properties
  - Provide query APIs for dashboards and exports

API surface:
  POST /v1/track            -> Ingest a single event
  POST /v1/batch            -> Ingest a batch of events (up to 500)
  GET  /v1/query             -> Run an aggregation query
  GET  /v1/funnels/{id}     -> Get funnel conversion data
  GET  /v1/retention         -> Get cohort retention data
  GET  /v1/events/export    -> Export raw events (paginated)
  POST /v1/dashboards       -> Create a dashboard with saved queries

Event schema:
  {
    "event":       "button_clicked",
    "user_id":     "user_abc",
    "anonymous_id": "anon_xyz",
    "timestamp":   "2026-04-03T14:22:00Z",
    "properties":  { "button_name": "signup", "page": "/home" },
    "context":     { "device": "iPhone", "os": "iOS 19", "ip": "..." }
  }
Non-Functional Requirements
Performance:
  - Ingest latency: < 50ms p99 for event acceptance
  - Event-to-dashboard latency: < 30 seconds for real-time metrics
  - Query latency: < 2 seconds for pre-aggregated dashboards
  - Ad-hoc query latency: < 30 seconds over 90-day windows

Throughput:
  - 500,000 events per second peak ingestion
  - 10,000 dashboard queries per second

Durability:
  - Zero event loss after acknowledgment
  - Events persisted in warehouse for 2+ years

Availability:
  - 99.99% uptime for ingestion (losing events is unacceptable)
  - 99.9% for query serving (brief degradation is tolerable)

Scalability:
  - Linear horizontal scaling for ingestion and processing
  - Support 100,000+ distinct event types per tenant
Estimation
Traffic:
  - 500,000 events/sec peak ingestion
  - Average event size: 500 bytes (after compression: ~200 bytes)
  - Daily events: 500K * 86,400 = 43.2 billion events/day

Storage:
  - Raw events: 43.2B * 500 bytes = ~21.6 TB/day uncompressed
  - Compressed (columnar, ~10x): ~2.2 TB/day in warehouse
  - 2-year retention: ~1.6 PB compressed
  - Pre-aggregated tables: ~5% of raw = ~110 GB/day

Bandwidth:
  - Ingest: 500K/sec * 500 bytes = 250 MB/sec inbound
  - Internal (to Kafka): 250 MB/sec * 3 replicas = 750 MB/sec
  - Warehouse writes: ~25 MB/sec (compressed, batched)

Compute:
  - Stream processors: 500K events/sec / 50K per instance = 10 instances
  - With headroom and partitioning: ~30 stream processor instances
  - Query nodes: depends on concurrency, start with 10 nodes
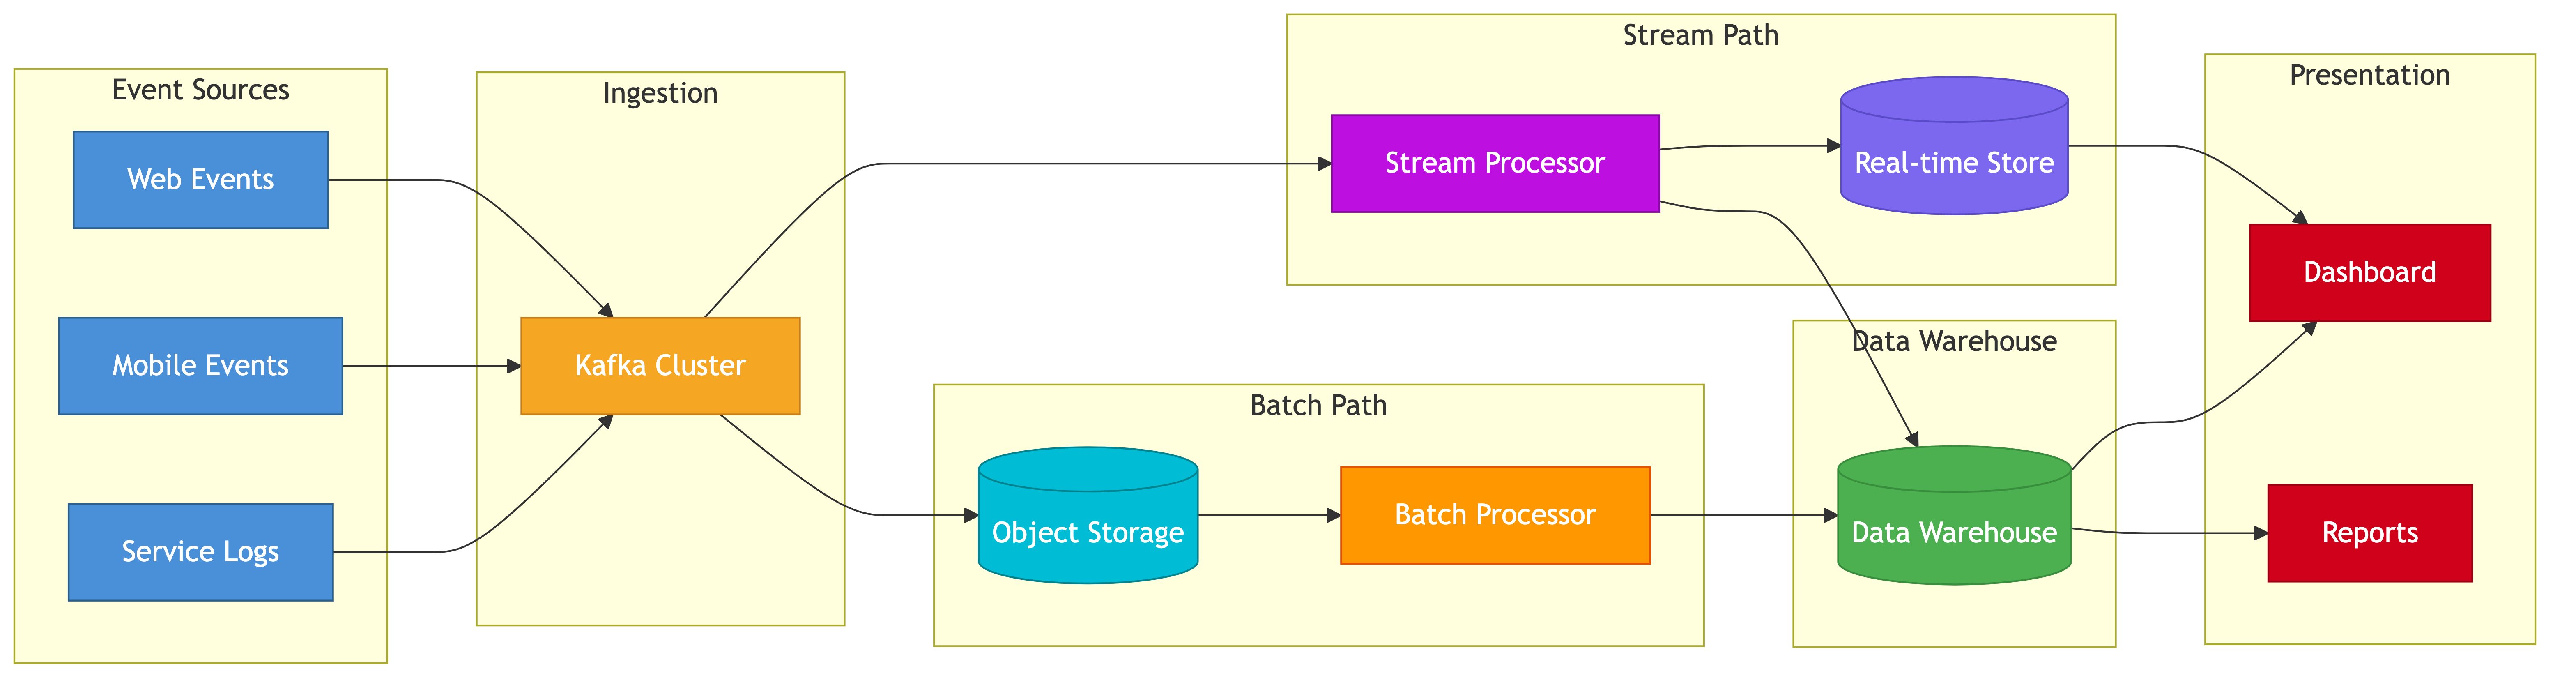
High-Level Design
Event Sources (Web SDK, Mobile SDK, Server API)
       |
       v
  Ingestion Layer (stateless HTTP receivers behind load balancer)
       |
       v
  Message Broker (Kafka)
       |
       +--> Real-Time Path (stream processors)
       |         |
       |         v
       |    Real-Time Aggregation Store (Redis / Apache Druid)
       |         |
       |         v
       |    Dashboard Query Service
       |
       +--> Batch Path (periodic jobs)
       |         |
       |         v
       |    Data Warehouse (ClickHouse / BigQuery / Snowflake)
       |         |
       |         v
       |    Ad-Hoc Query Service
       |
       +--> Raw Event Archive (S3 / GCS as Parquet files)

  Identity Resolution Service (merge anonymous + known users)
Component Responsibilities
Ingestion Layer:
  - Validates event schema and required fields
  - Enriches events (IP geolocation, device parsing)
  - Assigns server-side receive timestamp
  - Writes to Kafka, returns 202 Accepted
  - Stateless: any instance can handle any request

Kafka:
  - Durable buffer between ingestion and processing
  - Partitioned by user_id for ordering guarantees per user
  - Retention: 7 days (allows reprocessing from source)
  - Multiple consumer groups: real-time, batch, archival

Stream Processors (Flink / Kafka Streams):
  - Compute real-time aggregations: counts, unique users, sums
  - Maintain windowed state (1-minute, 5-minute, 1-hour windows)
  - Emit aggregated results to the real-time store
  - Handle late-arriving events via watermarks

Data Warehouse:
  - Stores all raw events in columnar format
  - Optimized for analytical queries over large time ranges
  - Partitioned by date, clustered by event type
  - Powers ad-hoc exploration and historical reports
Detailed Design
Event Ingestion (High Throughput)
Ingestion server design:
  - Stateless HTTP servers behind a load balancer
  - Accept single events (POST /track) and batches (POST /batch)
  - Validate: required fields present, timestamp within 7-day window
  - Enrich: parse user agent, geolocate IP, normalize timestamps to UTC
  - Produce to Kafka topic "events" with key = user_id
  - Return 202 Accepted immediately (do not wait for processing)

Backpressure handling:
  - If Kafka producer queue is full, return 429 Too Many Requests
  - Client SDKs implement local buffering with retry
  - SDKs batch events locally (Segment SDK batches 20 events or 30 seconds)

Client-side reliability:
  - SDK persists events to local storage before sending
  - On send failure, retry with exponential backoff
  - On app close, flush remaining events on next launch
  - Deduplicate via client-generated message_id

Segment handles 500K+ events/sec using this pattern. Their ingestion
layer is entirely stateless, making horizontal scaling trivial.
Each ingestion node handles ~50K events/sec.
Stream Processing (Real-Time Path)
Processing topology (Apache Flink):

  Kafka Source
       |
       v
  Deduplication (keyed by message_id, 1-hour window)
       |
       v
  Event Router (split by aggregation type)
       |
       +---> Page View Counter (tumbling 1-minute windows)
       +---> Unique User Counter (sliding 1-hour windows, HyperLogLog)
       +---> Funnel Stage Tracker (session windows per user)
       +---> Revenue Aggregator (tumbling 1-minute windows)
       |
       v
  Sink to Real-Time Store (Redis / Druid)

Window types:
  Tumbling window: fixed, non-overlapping (every 1 minute)
    Good for: event counts, sum of revenue
  Sliding window: overlapping, recalculated continuously
    Good for: "unique users in the last hour" (updated every minute)
  Session window: dynamic, per user, gap-based (30-min inactivity gap)
    Good for: funnel analysis, session duration

State management:
  Flink maintains state in RocksDB (local) with checkpoints to S3.
  Checkpoint interval: 1 minute.
  On failure, Flink restores from last checkpoint and replays Kafka.

Spotify uses Flink for real-time listening metrics. Their pipeline
processes billions of play events daily with sub-minute latency
from event occurrence to dashboard visibility.
Batch vs Real-Time Processing
Lambda architecture runs both paths:

  Real-time: Flink processes events as they arrive, writes approximate
  aggregations to Redis/Druid, serves dashboards with < 30s delay.

  Batch: Runs hourly/daily via Spark/dbt, reads raw events from warehouse,
  computes exact aggregations, overwrites real-time approximations,
  handles late-arriving events that missed the stream window.

Why both: Real-time alone misses late events and accumulates drift.
Batch alone has unacceptable latency. Batch acts as correction layer.

Kappa alternative: Use only streaming with long watermarks. Reprocess
by replaying Kafka. Netflix uses this approach, replaying from Kafka
when corrections are needed. Works when late arrivals are < 1%.

Recommendation: Start with Lambda. Move to Kappa only when your
streaming pipeline is mature and late-arrival rates are understood.
Data Warehouse Design
Table: events (ClickHouse example)
  event_id        UUID
  event_name      LowCardinality(String)
  user_id         String
  anonymous_id    String
  timestamp       DateTime64(3)    -- event timestamp from client
  received_at     DateTime64(3)    -- server receive time
  properties      Map(String, String)
  context_device  LowCardinality(String)
  context_os      LowCardinality(String)
  context_country LowCardinality(String)
  date            Date             -- partition key

Partitioning: BY toYYYYMM(date)
  Each month is a separate partition for efficient pruning.

Ordering key: (event_name, user_id, timestamp)
  Optimized for "give me all page_views for user X in March."

Materialized views for common aggregations:
  daily_event_counts:   GROUP BY event_name, date
  hourly_uniques:       GROUP BY event_name, toStartOfHour(timestamp)

ClickHouse achieves 100x compression with columnar storage. Cloudflare
uses it for analytics, querying trillions of rows sub-second.
Mixpanel migrated from custom storage to a columnar store at scale.
Aggregation & Dashboards
Pre-aggregation strategy:
  Common queries are pre-computed, not run on raw data.

  Level 1 - Real-time (Redis):
    Key: metric:{event}:{granularity}:{window}
    Example: metric:signup:1min:202604031422
    Value: count=1523, unique_users=1401 (HyperLogLog)
    TTL: 48 hours (real-time data is short-lived)

  Level 2 - Hourly rollups (ClickHouse materialized view):
    Aggregated from raw events every hour. Used for > 48h dashboards.

  Level 3 - Daily rollups:
    Aggregated from hourly rollups. Used for weekly/monthly/yearly trends.

Dashboard query routing:
  Query for "signups in last 30 minutes" -> Redis (Level 1)
  Query for "signups today" -> ClickHouse hourly rollup (Level 2)
  Query for "signups this quarter" -> ClickHouse daily rollup (Level 3)
  The query service picks the appropriate level automatically.

Funnel computation:
  Check if users completed steps in order within conversion window.
  Pre-computed nightly. Real-time approximation via session windows.
  Amplitude serves dashboards from pre-aggregated tables, hitting
  raw data only for novel ad-hoc explorations.
Late-Arriving Events
Problem:
  Mobile devices go offline. Events timestamped at 2:00 PM may arrive
  at 5:00 PM. The 2:00 PM aggregation window is already closed.

Watermark-based handling (Flink):
  Watermark = "I believe all events before this timestamp have arrived"
  Watermark = max_event_time - allowed_lateness
  Default allowed_lateness: 1 hour

  Events arriving within the watermark: processed normally.
  Events arriving after the watermark: "late events."

Late event strategies:
  1. Drop and log: Discard from real-time, batch corrects later. Simple.
  2. Side output: Route to separate topic, dedicated consumer updates
     affected windows. More complex but keeps real-time accurate.
  3. Allowed lateness: Flink updates already-fired windows on late arrival.
     Most accurate but increases write amplification.

Recommendation: Use strategy 1 for dashboards (accept ~1% inaccuracy).
Batch correction runs hourly. Raw events always land in the warehouse
regardless of lateness. Google Analytics uses this approach, showing
"data may take 24-48 hours" for certain reports.
Exactly-Once Processing
End-to-end exactly-once requires three layers:

Layer 1 - Ingestion dedup: Client SDK generates unique message_id.
  Ingestion checks against Bloom filter + Redis (TTL 1 hour).
  Catches duplicate sends from client retries.

Layer 2 - Stream processing: Flink checkpoints operator state + Kafka
  offsets. On failure, restores and replays from checkpointed offset.
  Idempotent sinks prevent double-counting on reprocessing.
  Kafka-to-Kafka uses two-phase commit. Kafka-to-DB uses idempotent
  upserts keyed on window + dimension.

Layer 3 - Warehouse loading: Each batch uses a deterministic batch_id.
  Check if batch_id exists before loading. Use warehouse-native dedup
  (BigQuery MERGE, ClickHouse ReplacingMergeTree) as a safety net.

Segment provides a message_id for downstream deduplication, pushing
idempotency to consumers. This is the pragmatic approach at scale.
Identity Resolution
Problem: A user browses anonymously (anonymous_id = "anon_xyz"), then
signs up (user_id = "user_abc"). Pre-signup events must be attributed
to the known user for accurate funnel and retention analysis.

Resolution flow:
  1. SDK calls /v1/identify with { anonymous_id, user_id }
  2. Identity service stores mapping: anon_xyz -> user_abc
  3. New events with anonymous_id are enriched with resolved user_id
  4. Historical events are re-attributed via batch backfill

On event arrival:
  If user_id present: use directly.
  If only anonymous_id: check Redis cache for mapping.
  If not found: store with anonymous_id, resolve later via batch.

Segment merges device-level anonymous IDs into a single user profile,
enabling cross-device funnel analysis.
Trade-Offs & Alternatives
ClickHouse vs BigQuery vs Snowflake:
  ClickHouse:
    + Self-hosted, low query latency, great compression
    - Operational burden, manual scaling and replication
  BigQuery:
    + Fully managed, scales to petabytes, SQL-native
    - Higher cost at high query volume, cold start latency
  Snowflake:
    + Separation of compute and storage, concurrency scaling
    - Expensive for continuous real-time workloads
  Recommendation: ClickHouse for low-latency interactive dashboards.
  BigQuery/Snowflake for ad-hoc analysis and data science workloads.

Flink vs Kafka Streams vs Spark Streaming:
  Flink: true streaming with exactly-once, but operationally complex.
  Kafka Streams: simple library deployment, but Kafka-only sources.
  Spark Structured Streaming: unified batch/stream, but micro-batch latency.
  Recommendation: Flink for low-latency. Spark if already in your stack.

Pre-aggregation vs query-time aggregation:
  Pre-aggregate known dashboard queries for fast, predictable latency.
  Fall back to query-time aggregation for ad-hoc exploration.
  The trade-off is rigidity vs flexibility.

Lambda vs Kappa architecture:
  Lambda (stream + batch): batch corrects stream errors, but two codepaths.
  Kappa (stream only): simpler, but reprocessing requires Kafka replay.
  Recommendation: Lambda for production analytics. The batch correction
  layer is worth the overhead.
Bottlenecks & Scaling
Bottleneck: Kafka partition hot spots
  If events are keyed by user_id, power users create hot partitions.
  Solution: Use a compound key (user_id + event_type) or add a random
  suffix for high-volume users. Re-partition downstream for user-keyed
  processing.

Bottleneck: Real-time store (Redis) memory limits
  Pre-aggregated metrics for thousands of event types across many
  time windows consume significant memory.
  Solution: Use tiered TTLs. 1-minute granularity for 2 hours,
  5-minute for 24 hours, 1-hour for 7 days. Expire fine-grained
  windows aggressively.

Bottleneck: Warehouse write throughput
  Solution: Buffer in Kafka, write micro-batches every 10-30 seconds.
  ClickHouse's MergeTree engine is designed for this batch insert pattern.

Bottleneck: Query fan-out on large time ranges
  Solution: Use rollup tables. The query router selects the coarsest
  granularity that satisfies the request (daily for yearly queries).

Bottleneck: Stream processor state size
  Solution: Use approximate data structures (HLL, Count-Min Sketch).
  Limit tracked dimensions. Offload historical state to the batch layer.

Scaling path:
  Phase 1 (< 10K/sec): Single Kafka, one Flink job, single ClickHouse node.
  Phase 2 (10K-100K/sec): 10+ Kafka brokers, Flink cluster, sharded ClickHouse.
  Phase 3 (100K+/sec): Multi-region Kafka, per-aggregation Flink jobs,
    10+ ClickHouse shards with tiered hot/cold storage.
Common Pitfalls
1. Using event time without watermarks
   Events arrive out of order. If you aggregate by event timestamp
   without watermarks, late events are silently dropped or misattributed.
   Always configure allowed lateness in your stream processor.

2. Storing raw events only in Kafka
   Kafka retention is finite (days to weeks). If you rely on Kafka as
   your long-term store, a reprocessing job that needs 6-month history
   will fail. Archive raw events to object storage in Parquet format.

3. No client-side deduplication ID
   Without a client-generated message_id, retries from the SDK create
   duplicate events. Downstream counts become inflated. Always generate
   a unique ID on the client before sending.

4. Pre-aggregating too many dimensions
   If you pre-aggregate every combination of event type, country, device,
   and browser, the number of time series explodes combinatorially.
   Pre-aggregate only the top 10-20 dashboard queries. Serve the rest
   from raw data at query time.

5. Ignoring schema evolution
   Event schemas change as the product evolves. New properties get added,
   old ones are renamed. Without a schema registry (Confluent, Protobuf),
   downstream consumers break on unknown fields. Version your schemas
   and maintain backward compatibility.

6. Single consumer group for all processing
   If your real-time aggregator and warehouse loader share a consumer
   group, a slow warehouse load blocks real-time processing. Use separate
   consumer groups so each path progresses independently.

7. Dashboard queries hitting raw events
   Allowing dashboard widgets to scan raw event tables at query time
   works for small datasets but causes timeouts at scale. Always serve
   dashboards from pre-aggregated tables or materialized views.
Key Takeaways
1. Separate ingestion from processing. Stateless ingestion servers
   that write to Kafka and return 202 Accepted give you a durable
   buffer and let each layer scale independently.

2. Use Lambda architecture for production analytics. The real-time
   stream path serves live dashboards; the batch path corrects errors
   and incorporates late-arriving events.

3. Pre-aggregate known queries, serve ad-hoc from raw data. This
   balances dashboard performance with query flexibility.

4. Handle late-arriving events explicitly. Configure watermarks in
   stream processing and rely on batch correction for events that
   arrive outside the allowed lateness window.

5. Exactly-once is a system property, not a component feature. It
   requires deduplication at ingestion, checkpointed processing in
   the stream layer, and idempotent writes to the storage layer.

6. Tiered storage reduces cost dramatically. Hot data in Redis (hours),
   warm data in ClickHouse (months), cold data in S3 Parquet (years).

7. Approximate data structures (HyperLogLog, Count-Min Sketch) make
   real-time unique counts and top-K queries feasible at scale without
   maintaining exact per-user state.