Kernel Internals: Linux
Architecture Overview
Linux is a monolithic kernel with dynamically loadable modules. All core subsystems (scheduler, memory management, file systems, networking, drivers) run in a single address space (ring 0 on x86).
User space:  applications -> glibc -> syscall interface
             -----------------------------------------------
Kernel:      System call dispatch (syscall table)
             |
             +-- Process scheduler (CFS/EEVDF)
             +-- Memory management (buddy, SLUB, page cache, VMAs)
             +-- VFS (virtual file system switch)
             +-- Block I/O layer (multi-queue)
             +-- Networking stack (TCP/IP, NAPI, XDP)
             +-- Device drivers (char, block, net)
             +-- Security modules (LSM framework)
             +-- Tracing/observability (ftrace, kprobes, eBPF)
Key design decisions:
- Monolithic for performance (no IPC between subsystems)
- Modules for flexibility (drivers loaded/unloaded at runtime)
- GPL license enforces open drivers (with limited exceptions)
CPU Scheduler
CFS (Completely Fair Scheduler)
CFS (Linux 2.6.23 - 6.5) models an ideal multitasking CPU where each task gets an equal share of processing time.
Core mechanism:
- Each task tracks
vruntime(virtual runtime), normalized by its weight (derived from nice value) - Tasks are stored in a red-black tree ordered by
vruntime - The scheduler always picks the task with the smallest
vruntime - Time slice is proportional to the task's weight relative to all runnable tasks
vruntime += delta_exec * (NICE_0_WEIGHT / task_weight)

Nice -20: weight 88761 (runs ~80x more than nice 19)
Nice   0: weight  1024 (baseline)
Nice  19: weight    15
Scheduling classes (priority order):
SCHED_DEADLINE-- earliest deadline firstSCHED_FIFO/SCHED_RR-- real-time, fixed prioritySCHED_NORMAL(CFS/EEVDF) -- default time-sharingSCHED_IDLE-- only runs when nothing else wants the CPU
EEVDF (Earliest Eligible Virtual Deadline First)
EEVDF replaced CFS in Linux 6.6. It addresses CFS's weakness in latency fairness for interactive tasks.
Key improvements:
- Each task has a virtual deadline = vruntime + (time_slice / weight)
- Among eligible tasks (those with vruntime <= fair share), the one with the earliest virtual deadline runs
- Eliminates the need for heuristic latency hacks (CFS's
sched_latency,sched_min_granularity) - Better tail latency for interactive workloads
Load Balancing (SMP)
- Per-CPU run queues to minimize lock contention
- Periodic load balancing across scheduling domains (core, LLC, NUMA node)
- Load balanced by a weighted metric combining load and utilization
steal_task()for work stealing between idle and busy CPUs
Memory Management
Buddy Allocator
The buddy allocator manages physical page frames. It maintains free lists for orders 0-10 (1 page to 1024 pages = 4 MB).
Allocation: Find the smallest free block >= requested size. If a larger block is used, split it into buddies and free the unused half.
Freeing: If the freed block's buddy is also free, coalesce them into a larger block. Repeat recursively.
Order:  0     1      2       3        ...  10
Size:   4KB   8KB    16KB    32KB          4MB
Buddy allocation is O(1) for common cases (free list lookup) and provides naturally aligned blocks.
SLUB Allocator
The buddy allocator has 4 KB granularity -- too coarse for kernel objects (task_struct ~6 KB, inode ~1 KB). SLUB provides fine-grained slab allocation.
Design:
- Object caches: pre-allocated pools of same-sized objects (e.g.,
kmem_cachefor each struct type) - Per-CPU freelists: allocation without locking in the fast path
- Partial slabs: pages with some free and some used objects, shared across CPUs
SLUB fast path:
  1. Check per-CPU freelist -> return object (no lock)
  2. If empty, check per-CPU partial list -> activate a partial slab
  3. If empty, check per-node partial list (lock required)
  4. If empty, allocate a new slab from the buddy allocator
Page Cache
The page cache buffers file data in memory, using unused RAM as a read/write cache.
- Backed by a radix tree (xarray): indexed by (inode, offset), O(1) lookup
- Writeback: dirty pages are flushed by
writebackkernel threads based on age and memory pressure - Readahead: sequential access triggers predictive prefetching (adaptive readahead algorithm)
- Page reclaim: under memory pressure, the kernel reclaims clean pages or writes back dirty ones
LRU lists: Pages are organized into active/inactive lists (both for anonymous and file-backed pages). The inactive list is scanned first for reclaim. Pages are promoted to active on second access.
Virtual File System (VFS)
VFS provides a uniform interface for all file systems. Applications call POSIX APIs; VFS dispatches to the appropriate file system implementation.
Key Abstractions
| Object | Purpose | Key Fields |
|---|---|---|
superblock |
Represents a mounted file system | block size, FS operations |
inode |
Represents a file (metadata) | permissions, size, timestamps |
dentry |
Directory entry (name -> inode mapping) | name, parent, inode pointer |
file |
An open file instance | offset, access mode, f_ops |
Dentry Cache
The dentry cache (dcache) accelerates pathname lookup by caching directory entries in a hash table. A path like /home/user/file.txt requires three dentry lookups; the dcache makes this fast.
- Negative dentries: cache "file not found" results to avoid repeated disk lookups
- Managed by LRU; reclaimed under memory pressure
Block I/O Layer
Multi-Queue Block (blk-mq)
blk-mq (Linux 3.13+) replaced the single-queue block layer to match NVMe's multi-queue hardware.
Per-CPU software queues -> Hardware dispatch queues -> NVMe HW queues
  (no contention)           (mapped to HW queues)     (per-core)
I/O schedulers for blk-mq:
none-- direct dispatch (best for NVMe with internal scheduling)mq-deadline-- merge and reorder with read/write deadlinesbfq-- budget fair queuing (good for interactive/desktop workloads)kyber-- low-overhead, latency-target-based (deprecated in newer kernels)
Networking
NAPI (New API)
NAPI combines interrupts with polling to handle high packet rates efficiently:
- First packet generates a hardware interrupt
- The interrupt handler disables further interrupts and schedules a NAPI poll
- The poll function processes packets in a batch (budget = 64 by default)
- When no more packets, re-enable interrupts
This prevents interrupt storms at high packet rates (livelock avoidance).
XDP (eXpress Data Path)
XDP attaches eBPF programs at the earliest point in the network receive path, before the kernel allocates an sk_buff.
XDP actions:
XDP_PASS-- continue normal stack processingXDP_DROP-- drop the packet (DDoS mitigation at line rate)XDP_TX-- transmit back out the same interface (load balancer)XDP_REDIRECT-- forward to another interface, CPU, or AF_XDP socket
Performance: XDP can process 10-40 million packets per second per core, rivaling DPDK without leaving the kernel.
eBPF
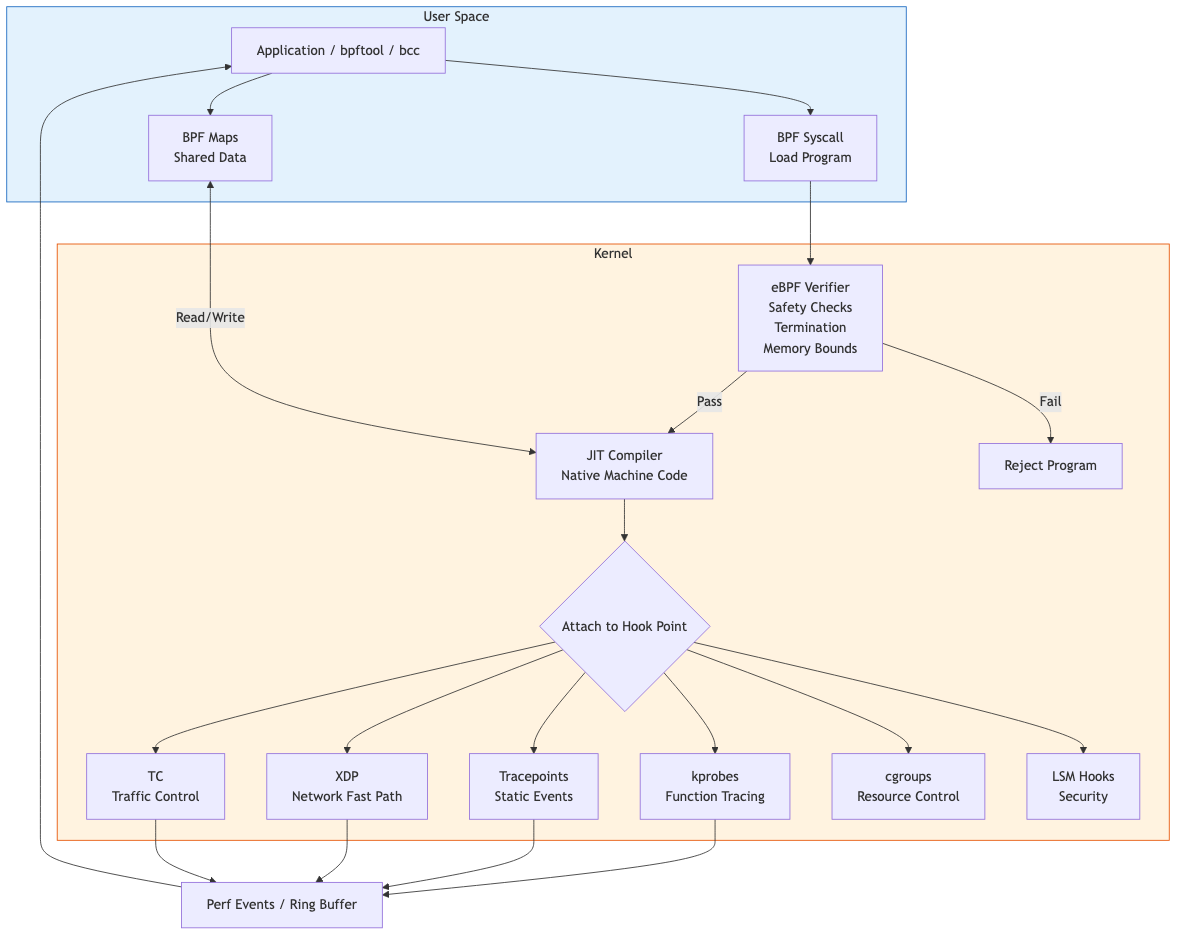
eBPF (extended Berkeley Packet Filter) is a programmable in-kernel virtual machine that allows safe execution of user-defined programs in kernel context.
Architecture
User space:
  C code -> clang/LLVM -> BPF bytecode -> bpf() syscall -> kernel

Kernel:
  Verifier -> JIT compiler -> native code -> attached to hook point
BPF Maps
Maps are key-value data structures shared between BPF programs and user space.
| Map Type | Use Case |
|---|---|
BPF_MAP_TYPE_HASH |
General key-value lookups |
BPF_MAP_TYPE_ARRAY |
Indexed array, O(1) access |
BPF_MAP_TYPE_PERF_EVENT_ARRAY |
Stream events to user space |
BPF_MAP_TYPE_RINGBUF |
Efficient event streaming (newer) |
BPF_MAP_TYPE_LRU_HASH |
Bounded-size cache |
BPF_MAP_TYPE_PERCPU_HASH |
Per-CPU counters (no locking) |
BPF Program Types
| Type | Hook Point | Example Use |
|---|---|---|
BPF_PROG_TYPE_XDP |
NIC driver RX path | DDoS filtering |
BPF_PROG_TYPE_SCHED_CLS |
TC (traffic control) | Container networking |
BPF_PROG_TYPE_KPROBE |
Kernel function entry | Tracing, debugging |
BPF_PROG_TYPE_TRACEPOINT |
Stable trace events | Performance monitoring |
BPF_PROG_TYPE_LSM |
Security hooks | Custom security policies |
BPF_PROG_TYPE_STRUCT_OPS |
Scheduler, TCP CC | Custom schedulers (sched_ext) |
BPF Verifier
The verifier statically analyzes every BPF program before loading:
- Ensures termination (no unbounded loops -- bounded loops allowed since 5.3)
- Validates memory access (no out-of-bounds reads/writes)
- Tracks register types and pointer arithmetic
- Enforces maximum instruction count (1M verified instructions)
- Prunes explored states for efficiency
CO-RE (Compile Once, Run Everywhere)
CO-RE solves the portability problem: BPF programs access kernel structs whose layout changes between versions.
- BTF (BPF Type Format) embeds type information in the kernel image
libbpfperforms relocations at load time, adjusting field offsets- Programs compiled on one kernel version run on others without recompilation
Tracing Infrastructure
kprobes
kprobes dynamically instruments any kernel function by inserting a breakpoint instruction:
- kprobe: fires on function entry
- kretprobe: fires on function return, capturing return value
- Used by BPF kprobe programs, ftrace, and SystemTap
ftrace
ftrace is the kernel's built-in function tracer:
- Function tracing via
mcount/fentryinstrumentation (compiled in, NOP-ed when inactive) - Function graph tracer: shows call/return hierarchy with timing
- Event tracing: structured tracepoints with format strings
- Controlled via
/sys/kernel/debug/tracing/
# Trace all ext4 functions
echo 'ext4_*' > /sys/kernel/debug/tracing/set_ftrace_filter
echo function > /sys/kernel/debug/tracing/current_tracer
echo 1 > /sys/kernel/debug/tracing/tracing_on
cat /sys/kernel/debug/tracing/trace
perf
perf is the user-space tool for hardware performance counters, software events, and tracepoints:
perf stat-- count events (cache misses, branch mispredictions)perf record/perf report-- sample-based profilingperf trace-- syscall tracing (strace replacement with lower overhead)
Key Takeaways
- EEVDF replaces CFS by adding virtual deadlines, improving latency fairness without heuristic tuning
- Memory management is layered: buddy (pages) -> SLUB (objects) -> page cache (file data) -> LRU reclaim
- VFS decouples applications from file system implementations through superblock/inode/dentry/file abstractions
- blk-mq's per-CPU queues match NVMe hardware parallelism, eliminating the single-queue bottleneck
- NAPI + XDP handle high packet rates: NAPI prevents interrupt storms, XDP processes packets before sk_buff allocation
- eBPF is a safe, programmable kernel extension mechanism with applications spanning networking, tracing, security, and scheduling
- CO-RE + BTF make eBPF programs portable across kernel versions