Dynamic Analysis
Instrumentation
Dynamic analysis observes program behavior at runtime. Instrumentation inserts monitoring code to collect information about executions.
Source-Level Instrumentation
Modify source code (or AST) to insert checks, logging, or tracking code before compilation. Advantages: language-aware, can access type information. Disadvantages: requires source code, language-specific.
Compiler-Based Instrumentation
Insert instrumentation during compilation. The compiler pass adds checks at precise program points with full semantic knowledge.
LLVM sanitizer passes: Clang's sanitizers instrument at the LLVM IR level. The compiler inserts check code around memory accesses, arithmetic operations, or synchronization primitives. This is the dominant approach for C/C++ dynamic analysis.
GCC sanitizers: Similar instrumentation via GCC's middle-end passes. Slightly different implementation details but equivalent capabilities.
Binary Instrumentation
Static binary instrumentation: Rewrite the binary before execution. Tools: PEBIL, Dyninst (static mode). Challenges: disassembly accuracy, handling indirect jumps, maintaining binary layout.
Dynamic binary instrumentation (DBI): Intercept and modify instructions at runtime via a just-in-time translation layer. Tools:
- Pin (Intel): x86/x86-64, high-level API, widely used in security research. Typical overhead: 2-5x.
- DynamoRIO: Open-source, supports x86/ARM/AArch64. Foundation for Dr. Memory.
- Valgrind: Translates to VEX IR, instruments, translates back. Higher overhead (10-50x) but extremely precise. Foundation for Memcheck, Helgrind, Cachegrind.
- Frida: Cross-platform (x86, ARM, MIPS). JavaScript API for instrumentation scripts. Popular for mobile security analysis (Android/iOS).
Profiling
CPU Profiling
Sampling-based: Periodically interrupt execution and record the program counter (and call stack). Statistical approximation of time distribution. Low overhead (1-5%). Tools: perf, Instruments (macOS), async-profiler (Java).
Instrumentation-based: Insert timing code at function entry/exit. Exact call counts and cumulative times. Higher overhead. Tools: gprof, callgrind (Valgrind).
Hardware performance counters: Modern CPUs provide counters for cache misses, branch mispredictions, TLB misses, instructions retired. Accessed via perf stat, PAPI, Intel VTune. Near-zero overhead for counting; sampling adds minimal cost.
Memory Profiling
Track allocation patterns, object lifetimes, memory footprint over time. Tools: Massif (Valgrind), heaptrack, Instruments (Allocations). Identifies memory leaks (objects allocated but never freed), excessive allocation rates, and memory fragmentation.
Cache and Memory Hierarchy Profiling
Cachegrind/Callgrind (Valgrind): Simulate L1/L2/L3 caches and count hits/misses per source line. Identifies cache-unfriendly access patterns. perf c2c: Detect false sharing (different threads accessing different data in the same cache line, causing coherence traffic).
Taint Analysis
Dynamic taint analysis tracks the flow of data from designated sources (untrusted inputs) through computations to sinks (security-sensitive operations).
Shadow Memory
Every byte (or bit, or word) of program memory has a corresponding shadow value recording its taint status. When data flows through operations, taint propagates:
x = y + z: taint(x) = taint(y) ∪ taint(z)x = load(addr): taint(x) = taint(mem[addr])store(addr, x): taint(mem[addr]) = taint(x)
Taint Policies
- Data-flow taint: Track explicit data dependencies only. Simple and common.
- Control-flow taint: If a branch condition is tainted, the branch target is implicitly influenced by tainted data. Tracking this avoids implicit flows but causes taint explosion (everything downstream of a tainted branch becomes tainted).
- Taint sanitization: Mark data as untainted after validation/sanitization functions.
Applications
- Vulnerability detection: Tainted data reaching
exec(),SQL(), format strings → injection vulnerability. - Privacy: Track sensitive data (passwords, PII) through the system; ensure it is never written to logs or sent unencrypted.
- Protocol reverse engineering: Track network input through a binary to understand message parsing structure.
Tools
TaintDroid (Android): Tracks information flow at the Dalvik VM level. Detects privacy leaks in Android apps. libdft: Pin-based taint tracking for x86 binaries. Triton: Combined symbolic execution and taint analysis.
Sanitizers
AddressSanitizer (ASan)
Detects memory errors: buffer overflows (stack, heap, global), use-after-free, use-after-return, double-free, memory leaks. Implemented via compiler instrumentation (Clang/GCC -fsanitize=address) plus a runtime library.
Mechanism: Allocate shadow memory mapping each 8-byte application region to a 1-byte shadow value encoding accessibility. Redzones (poisoned memory) surround every stack, heap, and global object. Every memory access is preceded by a shadow memory check: if (IsPoisoned(addr)) ReportError().
Quarantine: Freed memory is placed in a quarantine zone (FIFO queue) before being reused. Use-after-free is detected because the freed region's shadow is marked as poisoned. Quarantine size is configurable (time-memory tradeoff).
Performance: Typical overhead is 2x slowdown, 2-3x memory increase. Much lower than Valgrind's Memcheck (10-50x). Widely deployed in CI/CD pipelines.
MemorySanitizer (MSan)
Detects reads of uninitialized memory. Tracks initialization status via shadow memory — every bit of application memory has a shadow bit indicating whether it has been written. Reading an uninitialized shadow triggers a report.
Origin tracking: MSan can track where the uninitialized value was allocated (-fsanitize-memory-track-origins), providing actionable diagnostics.
Limitation: Requires the entire program (including libraries) to be compiled with MSan instrumentation. Uninstrumented code creates false negatives. Unlike ASan, MSan cannot be used with partially instrumented programs.
ThreadSanitizer (TSan)
Detects data races: concurrent accesses to the same memory location where at least one is a write and there is no synchronization between them.
Mechanism: Uses a vector clock algorithm. Each thread maintains a vector clock; each memory location stores the vector clock of its last access. On each access, TSan compares the current thread's clock with the location's clock to detect the happens-before relation violation.
Shadow state: Each 8-byte memory region has a shadow cell storing the last 4 accesses (thread ID, clock, access type). This fixed-size shadow enables efficient race detection with bounded memory.
Performance: 5-15x slowdown, 5-10x memory increase. Higher overhead than ASan due to per-access synchronization tracking.
UndefinedBehaviorSanitizer (UBSan)
Detects undefined behavior at runtime: signed integer overflow, null pointer dereference, misaligned access, out-of-bounds array indexing (with bounds information), type confusion (invalid downcasts), division by zero, unreachable code reached.
Lightweight checks — each is a simple comparison inserted at the relevant operation. Overhead is typically minimal (< 5%).
-fsanitize=undefined enables all UBSan checks. Individual checks can be toggled independently.
HWASan (Hardware-Assisted AddressSanitizer)
Uses ARM's Top Byte Ignore (TBI) or Memory Tagging Extension (MTE) to store a tag in pointer upper bits. Each memory allocation is assigned a random tag; accessing memory with a mismatched tag reports an error. Lower memory overhead than ASan (6% vs. 100%) at similar detection capability.
Fuzzing
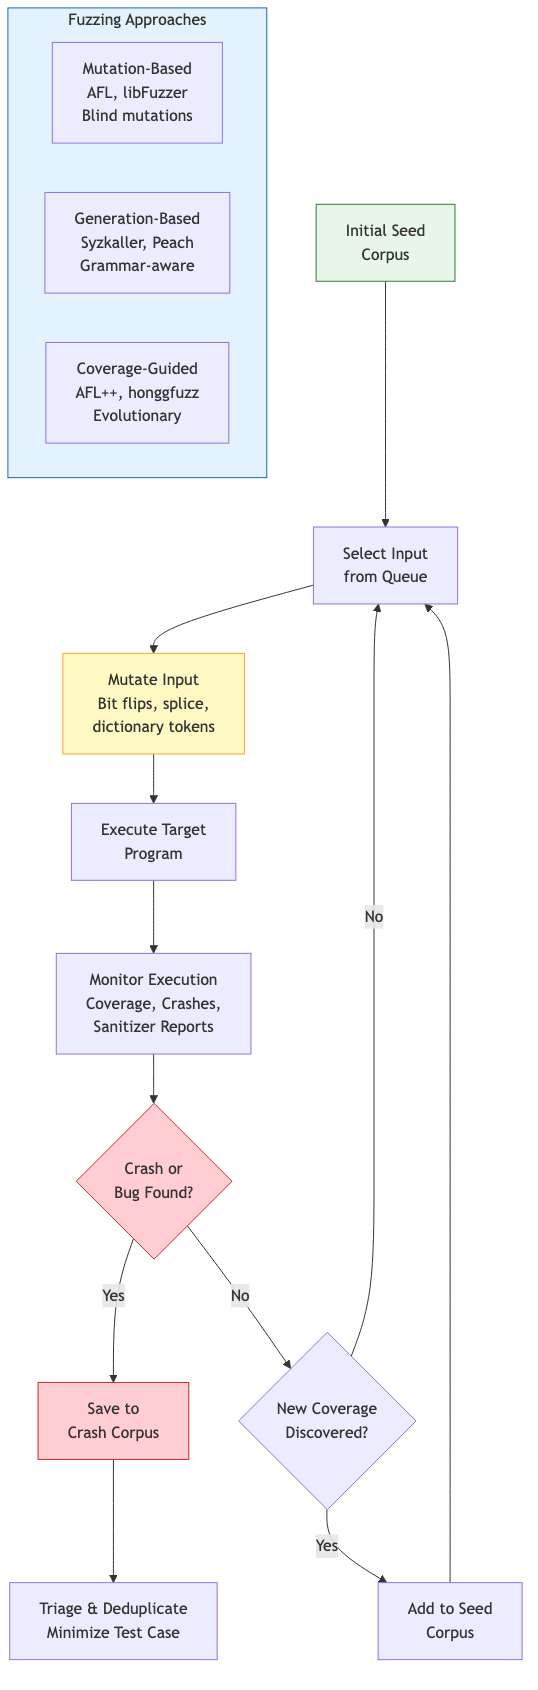
Mutation-Based Fuzzing
Start with a corpus of seed inputs. Mutate them randomly (bit flips, byte insertions, deletions, splicing) and feed mutated inputs to the target program. Monitor for crashes, hangs, or sanitizer violations.
Generation-Based Fuzzing
Generate inputs from a grammar or protocol specification. Produces structurally valid inputs that exercise deeper program logic. Tools: Peach, Dharma, Domato (for browser DOM/CSS fuzzing).
Coverage-Guided Fuzzing
AFL (American Fuzzy Lop)
Zalachenko's AFL (2013) pioneered practical coverage-guided fuzzing. Key innovations:
Coverage tracking: Instrument the binary (compile-time or QEMU-based) to record edge coverage as a bitmap. Each edge (branch source → target) is hashed to a bitmap index. The bitmap captures which edges were exercised, serving as a compact coverage fingerprint.
Evolutionary algorithm: If a mutated input triggers new coverage (new bitmap entries), it is added to the corpus. The corpus evolves toward higher coverage. Power schedules allocate mutation budget to seeds based on properties (execution speed, coverage gain, mutation history).
AFL++: Community fork with advanced features — collision-free coverage, custom mutators, persistent mode, QEMU/Unicorn mode, grammar-based mutation, CmpLog (instrumenting comparisons to guide mutations past magic bytes).
libFuzzer
LLVM's in-process coverage-guided fuzzer. The target is compiled as a library with a LLVMFuzzerTestOneInput(data, size) entry point. Runs in the same process — no fork overhead, 10-100x faster iteration than AFL for small targets. Uses SanitizerCoverage for edge tracking.
Corpus management: Minimizes the corpus to the smallest set of inputs achieving maximum coverage. Supports cross-pollination between fuzzer instances.
Structure-Aware Fuzzing
libprotobuf-mutator: Define the input structure as a Protocol Buffer message. Mutations operate on the protobuf structure, producing structurally valid inputs. Integrated with libFuzzer.
Grammar-based fuzzing: Generate inputs from a context-free grammar. Nautilus (2019) combines grammar-based generation with coverage guidance — mutates derivation trees rather than byte sequences.
Custom mutators: AFL++ and libFuzzer support user-defined mutators that understand the input format. Essential for complex formats (images, archives, network protocols).
OSS-Fuzz
Google's continuous fuzzing infrastructure for open-source projects. Integrates AFL++, libFuzzer, and Honggfuzz with ClusterFuzz (distributed execution). Runs fuzzers 24/7 on cloud infrastructure. Has found 40,000+ bugs in 1,000+ open-source projects including Chrome, OpenSSL, and the Linux kernel.
Concurrency Bug Detection
Data Race Detectors
TSan (see above) is the standard. Helgrind (Valgrind-based) is an alternative with higher overhead. FastTrack (Flanagan and Freund, 2009) optimized the vector clock algorithm: use an epoch (single clock entry) for the common case of exclusive access, upgrading to a full vector clock only when sharing is detected. Reduces overhead from O(n) to amortized O(1) per access.
Deadlock Detection
Construct a lock-order graph: nodes are locks, edges represent observed acquisition order (lock A held while acquiring B → edge A→B). A cycle in this graph indicates a potential deadlock. TSan and Helgrind perform lock-order checking. Undead (Cai and Cao): predictive deadlock detection using happens-before analysis on recorded traces.
Atomicity Violations
An atomicity violation occurs when a sequence of operations expected to execute atomically is interleaved with conflicting operations from another thread. AVIO (Lu et al., 2006): detect unserializable access interleavings by monitoring read-write patterns.
Runtime Verification
Runtime verification monitors program execution against formal specifications (temporal logic, regular expressions, automata). Unlike testing (which checks specific inputs) or static analysis (which approximates all executions), runtime verification checks the current execution precisely.
Monitor synthesis: From an LTL or regular specification, synthesize a finite-state monitor that consumes execution events and raises alarms on violations. The monitor runs alongside (or is instrumented into) the program.
JavaMOP (Monitoring-Oriented Programming): Framework for runtime verification of Java programs. Specifications in various formalisms (ERE, LTL, CFG) are compiled to AspectJ aspects that weave monitors into the program. Detects violations of API usage protocols, concurrency properties, and safety invariants.
RV-Monitor: Language-agnostic successor to JavaMOP. Generates C/C++ monitors from formal specifications.
Overhead Reduction
Runtime verification overhead depends on the frequency of monitored events. Techniques: sampling (check only a fraction of events), static optimization (use static analysis to prove some events are irrelevant), hardware acceleration (use hardware performance counters or processor trace for low-overhead event capture).