
Developer Experience
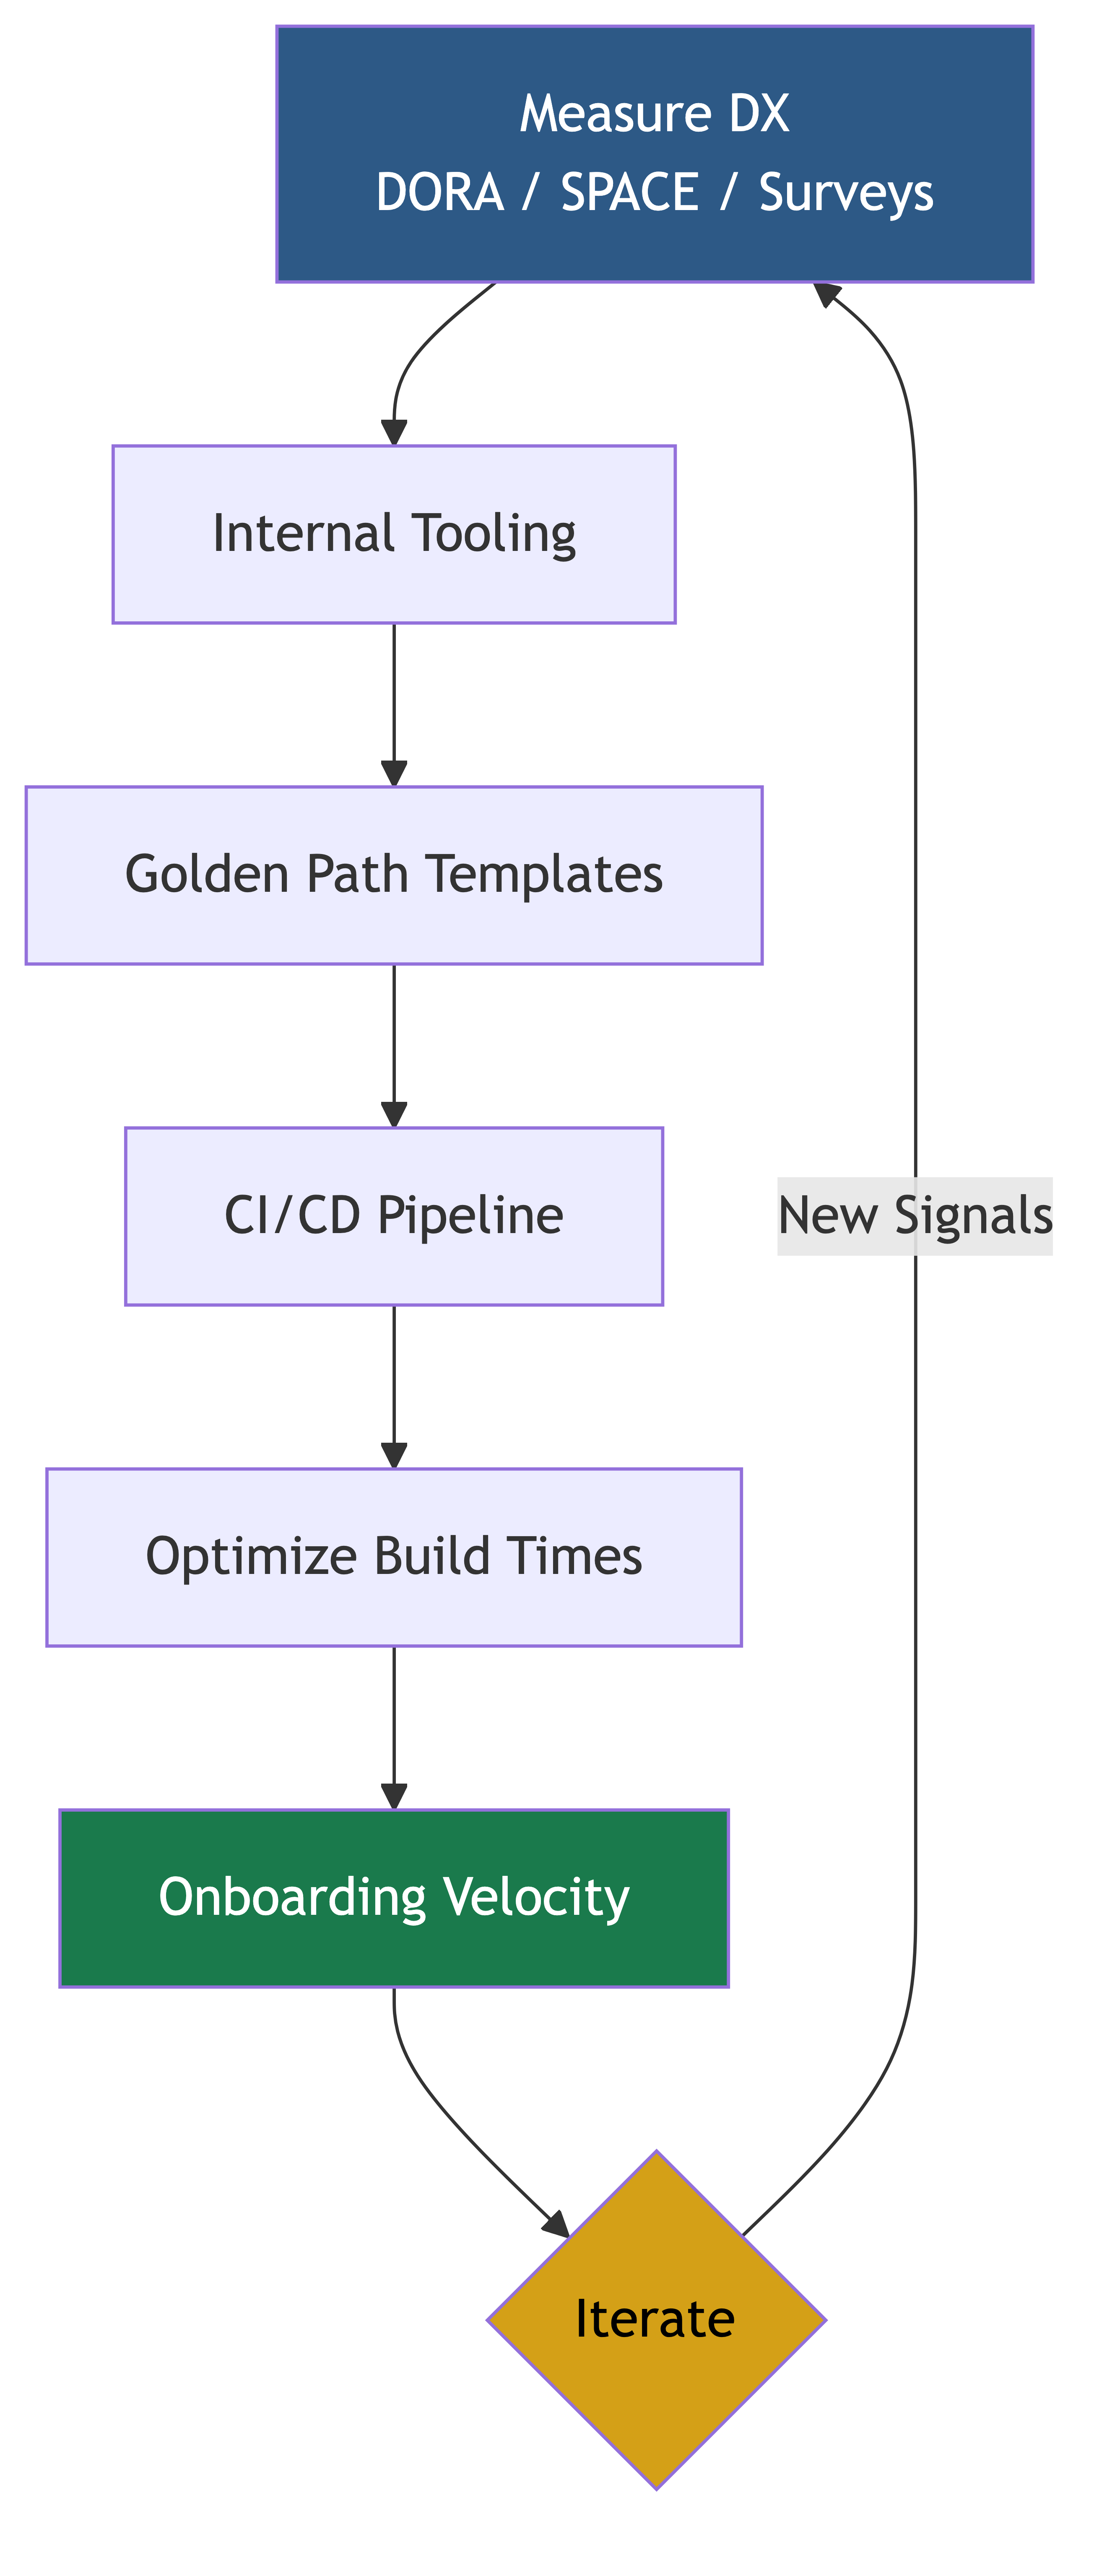
Why This Matters at the CTO Level
Developer experience (DX) is one of those things that seems like a luxury until you do the math. Here's the math: if you have 200 engineers, and each one spends 30 minutes a day waiting for builds, fighting broken tools, or navigating confusing internal systems, that's 100 hours of lost productivity per day. That's roughly 12.5 full-time engineers worth of output, every single day, evaporating into thin air.
At an average fully-loaded cost of 2.5M per year in waste. From build times alone.
And that's just the direct cost. The indirect costs are worse. Slow feedback loops discourage testing. Broken CI/CD pipelines discourage small, frequent deployments. Poor documentation discourages exploration and learning. Painful onboarding discourages experimentation with new services. Every friction point in the developer experience compounds into organizational drag.
As CTO, developer experience is one of your highest-leverage investments. You're not doing it because it's nice. You're doing it because every minute you save per developer, per day, multiplied across your entire engineering organization, multiplied across the entire year, adds up to millions of dollars in recovered productivity.
But it's not just about saving time. Great DX improves quality (because testing is easy, people test more), improves reliability (because deploying is easy, deploys are smaller and safer), and improves retention (because engineers who enjoy their tools stay longer than engineers who fight them).
DX Metrics: Measuring What Matters
You can't improve what you don't measure. But measuring developer experience is tricky because it involves both objective performance metrics and subjective satisfaction.
The DORA Metrics
The DORA (DevOps Research and Assessment) metrics are the industry standard for measuring software delivery performance. As CTO, you should track all four:
Deployment Frequency. How often does your organization deploy to production? Elite teams deploy on demand (multiple times per day). Low performers deploy monthly or less frequently.
Lead Time for Changes. How long does it take from code commit to code running in production? Elite teams: less than one day. Low performers: more than six months.
Mean Time to Restore (MTTR). When something breaks in production, how long does it take to restore service? Elite teams: less than one hour. Low performers: more than six months.
Change Failure Rate. What percentage of deployments cause a failure in production? Elite teams: 0-15%. Low performers: 46-60%.
These metrics are well-researched and correlate strongly with both engineering performance and business outcomes. If you track nothing else, track these.
The SPACE Framework
DORA metrics capture delivery performance, but DX is broader than that. The SPACE framework (from Microsoft Research and GitHub) provides a more comprehensive view:
Satisfaction and well-being. How do developers feel about their tools, processes, and work environment? Measured through surveys.
Performance. What outcomes are developers achieving? This goes beyond DORA metrics to include code quality, impact of features shipped, and customer outcomes.
Activity. What are developers doing? This includes code reviews, commits, deployments, and documentation. Be careful with activity metrics — they're easy to game and can incentivize the wrong behaviors.
Communication and collaboration. How effectively do developers work together? Measured through network analysis, review turnaround times, and meeting overhead.
Efficiency and flow. Can developers work without unnecessary interruptions and friction? Measured through focus time, wait times (PR reviews, CI builds, environment provisioning), and handoff frequency.
Developer Surveys
Surveys are the most direct way to understand developer experience. Run them quarterly, keep them short (10-15 questions), and act on the results.
Key questions to ask:
- "How productive do you feel on a typical day?" (scale of 1-10)
- "What's the biggest time waster in your workflow?"
- "How confident are you that your code changes won't break production?"
- "How easy is it to set up a new development environment?"
- "How long does it take to get your pull request reviewed?"
- "What tools or processes cause you the most frustration?"
The open-ended questions are often more valuable than the numerical scores. When 30 engineers independently mention the same pain point, that's a clear signal.
Build and CI/CD Metrics
These are the most immediately actionable DX metrics:
- Build time: How long does a local build take? How long does CI take?
- Build reliability: What percentage of CI runs fail due to infrastructure issues (not actual code problems)?
- Deployment time: How long from "merge to main" to "running in production"?
- Rollback time: How long to revert a bad deployment?
- Environment provisioning time: How long to spin up a new development or staging environment?
- Dependency resolution time: How long does it take to install/update dependencies?
Track these over time. If build times are creeping up, that's a leading indicator of DX degradation.
Internal Tooling Roadmap
Internal tooling is the infrastructure that developers use to build, test, deploy, and operate software. Most companies dramatically under-invest in it.
The Platform Team Model
As your engineering organization grows beyond about 50 engineers, you need a dedicated team (or teams) focused on internal developer tools and platforms. This team's customers are your engineers, and their product is the developer experience.
The platform team should own:
- CI/CD pipelines: Build, test, and deployment infrastructure
- Development environments: Local setup, remote development, preview environments
- Service scaffolding: Templates, boilerplate generators, and service frameworks
- Observability tooling: Logging, monitoring, alerting, and debugging tools
- Documentation platform: Where docs live, how they're organized, how they're kept up to date
- Internal APIs and SDKs: Shared libraries, common patterns, and internal services
Treating Internal Tools as Products
This is the mindset shift that separates great platform teams from mediocre ones. Internal tools need the same discipline as external products:
User research. Talk to your developers. Watch them work. Understand their pain points, their workflows, and their workarounds. Don't build what you think they need — build what they actually need.
Roadmap and prioritization. Maintain a visible roadmap. Prioritize based on impact (how many developers are affected, how much time is saved). Share the roadmap so teams know what's coming and can provide feedback.
Documentation and onboarding. Internal tools need documentation too. If a tool exists but nobody knows how to use it, it doesn't exist.
Support model. How do developers get help with internal tools? Slack channels, office hours, documentation? Define this explicitly.
Deprecation and migration. When you replace tools, provide migration paths. Don't just announce "the old tool is going away next month." Help teams migrate.
The Golden Path
A "golden path" (or "paved road") is the supported, recommended way to do common tasks. It's not the only way — engineers can go off-path when they have good reasons — but it's the path that's optimized, documented, and supported.
Examples of golden path components:
- Service creation:
create-service --name my-service --type httpgenerates a fully configured service with CI/CD, monitoring, logging, and deployment to staging. - Database provisioning:
provision-database --type postgres --env productioncreates a new database with proper security, backups, and monitoring. - Feature flags: A shared feature flag system with a UI for toggling flags, gradual rollout, and automatic cleanup of stale flags.
The golden path should be easier than the alternative. If going off-path is easier than following the paved road, your paved road is badly designed.
Developer Productivity Platform
At scale, individual tools converge into a developer productivity platform — an integrated set of tools and services that supports the entire software development lifecycle.
What a Developer Productivity Platform Looks Like
Code. Where does code live? How is it organized? What's the branching strategy? What code review tools are used?
Build. How does code get compiled, tested, and packaged? What's the build system? How are dependencies managed?
Deploy. How does code get to production? What's the deployment pipeline? How are rollbacks handled? What approval processes exist?
Run. How are services operated in production? What's the observability stack? How are resources provisioned and scaled?
Collaborate. How do developers communicate, share knowledge, and coordinate work? What's the documentation system?
Build vs. Buy for Platform Components
For most platform components, buy (or use open-source) rather than build:
| Component | Buy/OSS | Build |
|---|---|---|
| Source control | GitHub/GitLab | Almost never |
| CI/CD | GitHub Actions, CircleCI, BuildKite | Custom plugins/integrations |
| Container orchestration | Kubernetes, ECS | Abstractions on top |
| Observability | Datadog, Grafana Stack | Custom dashboards, integrations |
| Feature flags | LaunchDarkly, Split | Custom if deep product integration needed |
| Incident management | PagerDuty, OpsGenie | Custom integrations |
Build custom tooling only where it provides unique value tied to your specific architecture, workflow, or business requirements.
Internal Developer Portal
As your engineering organization grows, engineers need a single place to discover services, understand dependencies, find documentation, and access tooling. This is the internal developer portal.
A good developer portal includes:
- Service catalog: All services, their owners, their dependencies, their SLOs
- Documentation hub: Architecture docs, runbooks, API docs, how-to guides
- Tool directory: All internal tools, how to access them, who maintains them
- Onboarding guide: What a new engineer needs to know, in order
- Search: Full-text search across all documentation and service metadata
Backstage (from Spotify) has become the de facto standard for internal developer portals, but there are simpler options if you're not at Backstage-scale yet.
CI/CD Strategy
CI/CD is the heartbeat of your engineering organization. When it's working well, nobody notices. When it's broken, everything stops.
Continuous Integration Principles
Fast feedback. CI should tell developers whether their code is good within minutes, not hours. If your CI pipeline takes 45 minutes, developers will context-switch to other work while waiting, and each context switch costs them 15-20 minutes of refocusing. Target 10 minutes or less for the primary CI pipeline.
Reliable results. Flaky tests are the enemy of CI. If tests randomly fail 5% of the time, developers learn to ignore failures and retry. This completely defeats the purpose of CI. Track test flakiness. Quarantine flaky tests. Fix or delete them.
Comprehensive coverage. CI should catch issues before they reach production. This means unit tests, integration tests, linting, type checking, security scanning, and (where practical) performance testing. But comprehensiveness shouldn't come at the cost of speed.
Trunk-based development. The CI/CD strategy that delivers the best results is trunk-based development: small, frequent commits to the main branch, protected by CI checks. Long-lived feature branches create merge conflicts, integration risk, and deployment complexity.
Continuous Deployment Principles
Automated deployment. Deployments should be automated, repeatable, and boring. If a deployment requires a human to follow a 15-step checklist, something will eventually go wrong.
Progressive rollout. Don't deploy to all users at once. Canary deployments (deploy to 1% of traffic, monitor, then gradually increase) catch issues before they affect all users.
Easy rollback. Every deployment should be instantly reversible. If rolling back requires a 20-minute procedure, deployments become scary and infrequent. If rollback is one button click, deployments become routine.
Deploy and release are separate. Deploying code to production and releasing features to users should be independent operations. Feature flags let you deploy code that's not yet visible to users, test it in production, and release it when ready.
Every Minute Saved per Deploy Multiplies Across the Org
Let me do the math that makes CI/CD investment undeniable.
Say you have 200 engineers, each deploying an average of twice per week. That's 400 deployments per week. If your deployment pipeline takes 30 minutes, that's 200 hours per week spent waiting for deployments.
If you cut that to 10 minutes, you save 133 hours per week — that's 3.3 full-time engineers worth of productivity recovered, every single week.
Over a year, at 660K in recovered productivity from one improvement.
And that's just the direct time savings. Faster deployments mean:
- Engineers deploy more frequently (smaller, safer changes)
- Issues are caught earlier (less debugging time)
- Features reach customers faster (more revenue, more feedback)
- Engineers are happier (less frustration waiting)
This math applies to every part of the developer experience. Build times, test times, code review times, environment setup times — every minute saved multiplies across your entire organization.
Measuring Developer Satisfaction
Happy developers are productive developers. This isn't soft thinking — it's backed by research. Developer satisfaction correlates with retention, productivity, code quality, and even customer satisfaction.
What to Measure
Net Promoter Score for DX. "On a scale of 0-10, how likely are you to recommend our development environment to a friend?" This sounds silly, but it's a powerful summary metric. Track it quarterly and watch the trend.
Tool satisfaction. Rate each major tool on a 1-5 scale. Which tools do developers love? Which ones do they hate? The tools they hate are your biggest DX improvement opportunities.
Friction logs. Ask developers to keep a log for one week of every time they were blocked, frustrated, or had to work around a broken tool. The patterns in these logs are gold.
Time allocation. How do developers actually spend their time? Research consistently shows that developers spend only 30-40% of their time writing code. The rest goes to meetings, waiting, debugging tools, searching for information, and dealing with bureaucracy. Understanding the breakdown tells you where to focus DX improvements.
Developer Experience as a Retention Lever
Engineers leave organizations for many reasons, but frustration with tools and processes is consistently in the top five. When your build takes 45 minutes and your competitor's build takes 5 minutes, talented engineers notice.
Exit interviews and stay interviews consistently reveal that developers value:
- Working with modern, well-maintained tools
- Being able to deploy code quickly and safely
- Having clear, up-to-date documentation
- Being able to focus without constant interruptions
- Feeling that their time is respected (not wasted on bureaucracy)
Investing in DX is investing in retention. And given that replacing an engineer costs 6-12 months of their salary in recruiting, onboarding, and lost productivity, retention is one of the highest-ROI investments you can make.
Build Times: The Silent Productivity Killer
Build times deserve their own section because they're one of the most impactful and most overlooked DX issues.
Why Build Times Matter So Much
When a build takes 30 seconds, developers stay in flow. They make a change, see the result, iterate. The feedback loop is tight and productive.
When a build takes 5 minutes, developers context-switch. They check email, browse Slack, look at another task. When the build finishes, it takes them 10-15 minutes to get back into the context of what they were working on. A 5-minute build actually costs 20 minutes.
When a build takes 30 minutes, developers stop iterating. They make larger, riskier changes because each change is so expensive to validate. Code quality drops. Bugs increase. Developer frustration spikes.
Common Causes of Slow Builds
- Monorepo without proper build caching: Every change triggers a full rebuild of everything
- Too many integration tests in the critical path: Tests that spin up databases, external services, or browser automation
- Dependency resolution: Downloading dependencies on every build instead of caching
- Sequential steps that could be parallel: Linting, testing, building, and scanning running one after another instead of concurrently
- Under-provisioned CI infrastructure: Running builds on small machines to save money (penny wise, pound foolish)
Strategies for Faster Builds
Build caching. Cache build artifacts, test results, and dependencies. If the inputs haven't changed, don't rebuild. Tools like Bazel, Turborepo, and Nx provide sophisticated caching out of the box.
Parallelization. Run independent steps in parallel. Most CI pipelines have steps that don't depend on each other and can run simultaneously.
Test splitting. Distribute tests across multiple machines. A test suite that takes 20 minutes on one machine might take 5 minutes across four machines.
Incremental builds. Only rebuild what changed. This requires build tooling that understands dependency graphs, but the payoff is enormous.
Remote build execution. Run builds on powerful remote machines instead of developer laptops. Google's build system works this way, and it's why Google engineers can build massive projects quickly on any hardware.
Set a budget. Declare that CI must complete in under 10 minutes. Treat regressions as bugs. When someone adds a step that pushes CI over the budget, they need to optimize something else to compensate.
Onboarding Velocity as a DX Metric
How quickly a new engineer becomes productive is one of the most revealing DX metrics. If it takes a new hire four weeks to ship their first meaningful change, you have a DX problem.
What Good Onboarding Looks Like
Day 1: Laptop configured, accounts provisioned, development environment running, first "hello world" change deployed to a staging environment.
Week 1: First real (small) code change shipped to production. New hire has paired with at least two team members. They understand the codebase structure and can navigate it.
Week 2: Working independently on well-scoped tasks. Comfortable with the deployment process. Can find answers to common questions without asking.
Month 1: Fully productive on normal-sized tasks. Contributing to code reviews. Understanding the broader architecture.
What Slows Onboarding
- Manual environment setup: 47-step wiki pages for setting up a development environment, with steps 12 and 23 being subtly out of date
- Tribal knowledge: Critical information that exists only in people's heads, not in documentation
- Complex local dependencies: Needing to run 12 services locally to test one change
- Broken documentation: Documentation that's worse than no documentation because it's misleading
- No clear starting point: New hires don't know what to learn first or where to find information
Fixing Onboarding
Automate environment setup. One command should set up a complete development environment. If that's not possible today, make it a priority. Every new hire who struggles with setup is a canary in the coal mine telling you your DX needs work.
Curate an onboarding path. Don't dump a new hire into a wiki and wish them luck. Create a structured first-week experience with specific tasks, reading, and pairing sessions.
Use onboarding as a DX test. Every new hire should be asked to document the problems they encountered during onboarding. These are your DX bugs. Fix them before the next new hire starts.
Measure time to first PR. Track how long it takes each new hire to submit their first pull request. This is your onboarding velocity metric. If it's getting worse over time, your DX is degrading.
Real-World Examples
Example 1: The Build Time Revolution
A 300-engineer organization had CI builds averaging 42 minutes. Developers were deploying once or twice a week because each deploy cycle was so painful. The CTO commissioned a three-month project to fix build times.
Changes made:
- Implemented remote build caching (saved 15 minutes on average)
- Parallelized test execution across 8 machines (saved 12 minutes)
- Moved integration tests to a separate, non-blocking pipeline (saved 10 minutes)
- Upgraded CI machines from 4-core to 16-core (saved 5 minutes)
Result: CI builds dropped from 42 minutes to 8 minutes. Deployment frequency increased from 1-2 times per week to 2-3 times per day. Change failure rate dropped 40% (smaller deploys = less risk). Developer satisfaction scores on internal surveys increased by 25%.
Total investment: approximately 2.1M.
Example 2: The Golden Path That Nobody Used
A platform team spent six months building an elaborate service creation framework. It generated Kubernetes manifests, CI/CD pipelines, monitoring dashboards, and documentation templates. It was technically impressive.
Nobody used it.
The problem: the framework required engineers to learn a custom DSL, run a CLI tool with 15 configuration flags, and follow a 10-step post-creation process. It was faster and easier to just copy an existing service and modify it.
The fix: the team scrapped the complex framework and built a simple web form that asked three questions (service name, type, team) and generated everything automatically with sensible defaults. Adoption went from near-zero to 90% within a month.
Lesson: the best internal tool is the one that's easier than the workaround.
Example 3: The Onboarding Metric That Changed Everything
A CTO started tracking "time to first production deploy" for every new hire. The baseline was 23 days. After seeing the number, the CTO set a goal: under 5 days.
Changes made:
- Automated development environment setup (Docker Compose + setup script)
- Created a curated "first week" onboarding guide with specific tasks
- Designated "onboarding buddies" for each new hire
- Created a set of "good first issues" that were small, well-scoped, and low-risk
- Fixed 47 documentation issues discovered by recent new hires
Six months later, average time to first production deploy was 3.2 days. New hires reported feeling productive and welcomed. Retention at the 6-month mark improved by 15%.
Common Mistakes
Mistake 1: Treating DX as a Nice-to-Have
Deprioritizing developer experience in favor of "real work" (features). DX is real work. Every hour invested in DX is multiplied across every engineer in the organization for every day they work. Few feature investments have that kind of leverage.
Mistake 2: Building Without User Research
Platform teams that build tools based on what they think developers need, without actually talking to developers. Run surveys, do interviews, watch people work. The pain points are rarely where you expect them.
Mistake 3: Ignoring Build Time Creep
Accepting gradually increasing build times as inevitable. Build times should have a budget, just like any other performance metric. When the budget is exceeded, treat it as a bug.
Mistake 4: Optimizing for the Wrong Thing
Optimizing for tool sophistication rather than simplicity. The goal of DX is to reduce friction, not to build impressive internal tools. If your internal tool is harder to use than the thing it replaced, you've made things worse.
Mistake 5: No Dedicated Platform Team
Expecting product teams to maintain their own tooling, CI/CD pipelines, and deployment infrastructure. This leads to duplicated effort, inconsistent practices, and tools that nobody has time to maintain properly.
Mistake 6: Forgetting Documentation
Building great tools but not documenting them. Undocumented tools are undiscoverable tools. And documentation that's out of date is often worse than no documentation at all.
Mistake 7: Not Measuring
Making DX investments without measuring their impact. If you can't show that CI build times dropped from 40 minutes to 8 minutes, you can't justify continued investment in DX. Measure before, measure after, show the impact.
Business Value
Developer experience investment has direct, measurable business impact:
Productivity recovery. The math is simple and compelling. If DX improvements save each developer 30 minutes per day across 200 engineers, that's 100 hours per day, or roughly $5M per year in recovered productivity. Track the specific time savings and report them.
Faster time to market. When developers can deploy in minutes instead of hours, and iterate in seconds instead of minutes, features reach customers faster. Quantify this as the revenue impact of shipping features earlier.
Quality improvement. Better DX leads to better quality. Fast builds encourage frequent testing. Easy deployment encourages small, safe changes. Good observability catches issues before customers notice. Track the reduction in production incidents and customer-facing bugs.
Retention savings. Developers who enjoy their tools and processes stay longer. If DX investment improves retention by even 10%, the savings in recruiting and onboarding costs are substantial. At 250-500K.
Competitive advantage in hiring. In a competitive talent market, your developer experience is a selling point. Candidates talk to your current engineers. If your engineers say "the tools here are great and I can deploy to production on my first day," that attracts talent. If they say "the build takes 45 minutes and we deploy every two weeks," it repels talent.
Scaling efficiency. As you grow, DX determines whether adding engineers increases output proportionally or whether each additional engineer adds less value due to coordination overhead and tool limitations. Good DX makes engineering organizations scale linearly. Bad DX makes them scale sub-linearly or even plateau.
When presenting DX investment to the board, focus on the multiplier effect. "This 2.6M in annual productivity recovery, a 5:1 return on investment." That's a business case that sells itself.
Common Pitfalls
-
Treating developer experience as a nice-to-have. Deprioritizing DX in favor of feature work ignores that every hour invested in DX multiplies across every engineer for every day they work. Few feature investments have that kind of leverage.
-
Building platform tools without talking to developers. Platform teams that build based on assumptions rather than user research create tools that miss the actual pain points. Run surveys, do interviews, and watch people work.
-
Accepting gradually increasing build times as inevitable. Build times should have a budget just like any other performance metric. When the budget is exceeded, treat the regression as a bug that needs fixing.
-
Optimizing for tool sophistication instead of simplicity. The goal of DX is to reduce friction, not to build impressive internal tools. If the golden path is harder to use than the workaround, adoption will be near zero.
-
Neglecting documentation for internal tools. Undocumented tools are undiscoverable tools. And documentation that is out of date is often worse than no documentation because it misleads.
-
Making DX investments without measuring impact. If you cannot show that CI build times dropped from 40 minutes to 8 minutes, you cannot justify continued investment. Measure before, measure after, and present the results.
Key Takeaways
-
Developer experience is one of the highest-leverage investments a CTO can make. Every minute saved per developer per day, multiplied across the organization and the year, adds up to millions in recovered productivity.
-
Track the four DORA metrics (deployment frequency, lead time for changes, MTTR, change failure rate) as the baseline measure of software delivery performance.
-
A dedicated platform team is necessary once engineering exceeds about 50 people. Their customers are your engineers, and their product is the developer experience.
-
The golden path should be the path of least resistance. If going off-path is easier than following the paved road, the paved road is badly designed.
-
CI should provide feedback within 10 minutes. Flaky tests must be quarantined and fixed. Every minute saved on the deployment pipeline multiplies across every engineer and every deploy.
-
Onboarding velocity (time to first production deploy) is one of the most revealing DX metrics. If it takes a new hire four weeks to ship a meaningful change, you have a systemic DX problem.
-
Developer satisfaction correlates with retention, productivity, and code quality. Quarterly surveys with open-ended questions surface the friction points that metrics alone cannot capture.
-
Frame DX for the board as a multiplier: investment multiplied by engineers multiplied by days equals recovered productivity in dollar terms.