
Technical Debt Strategy
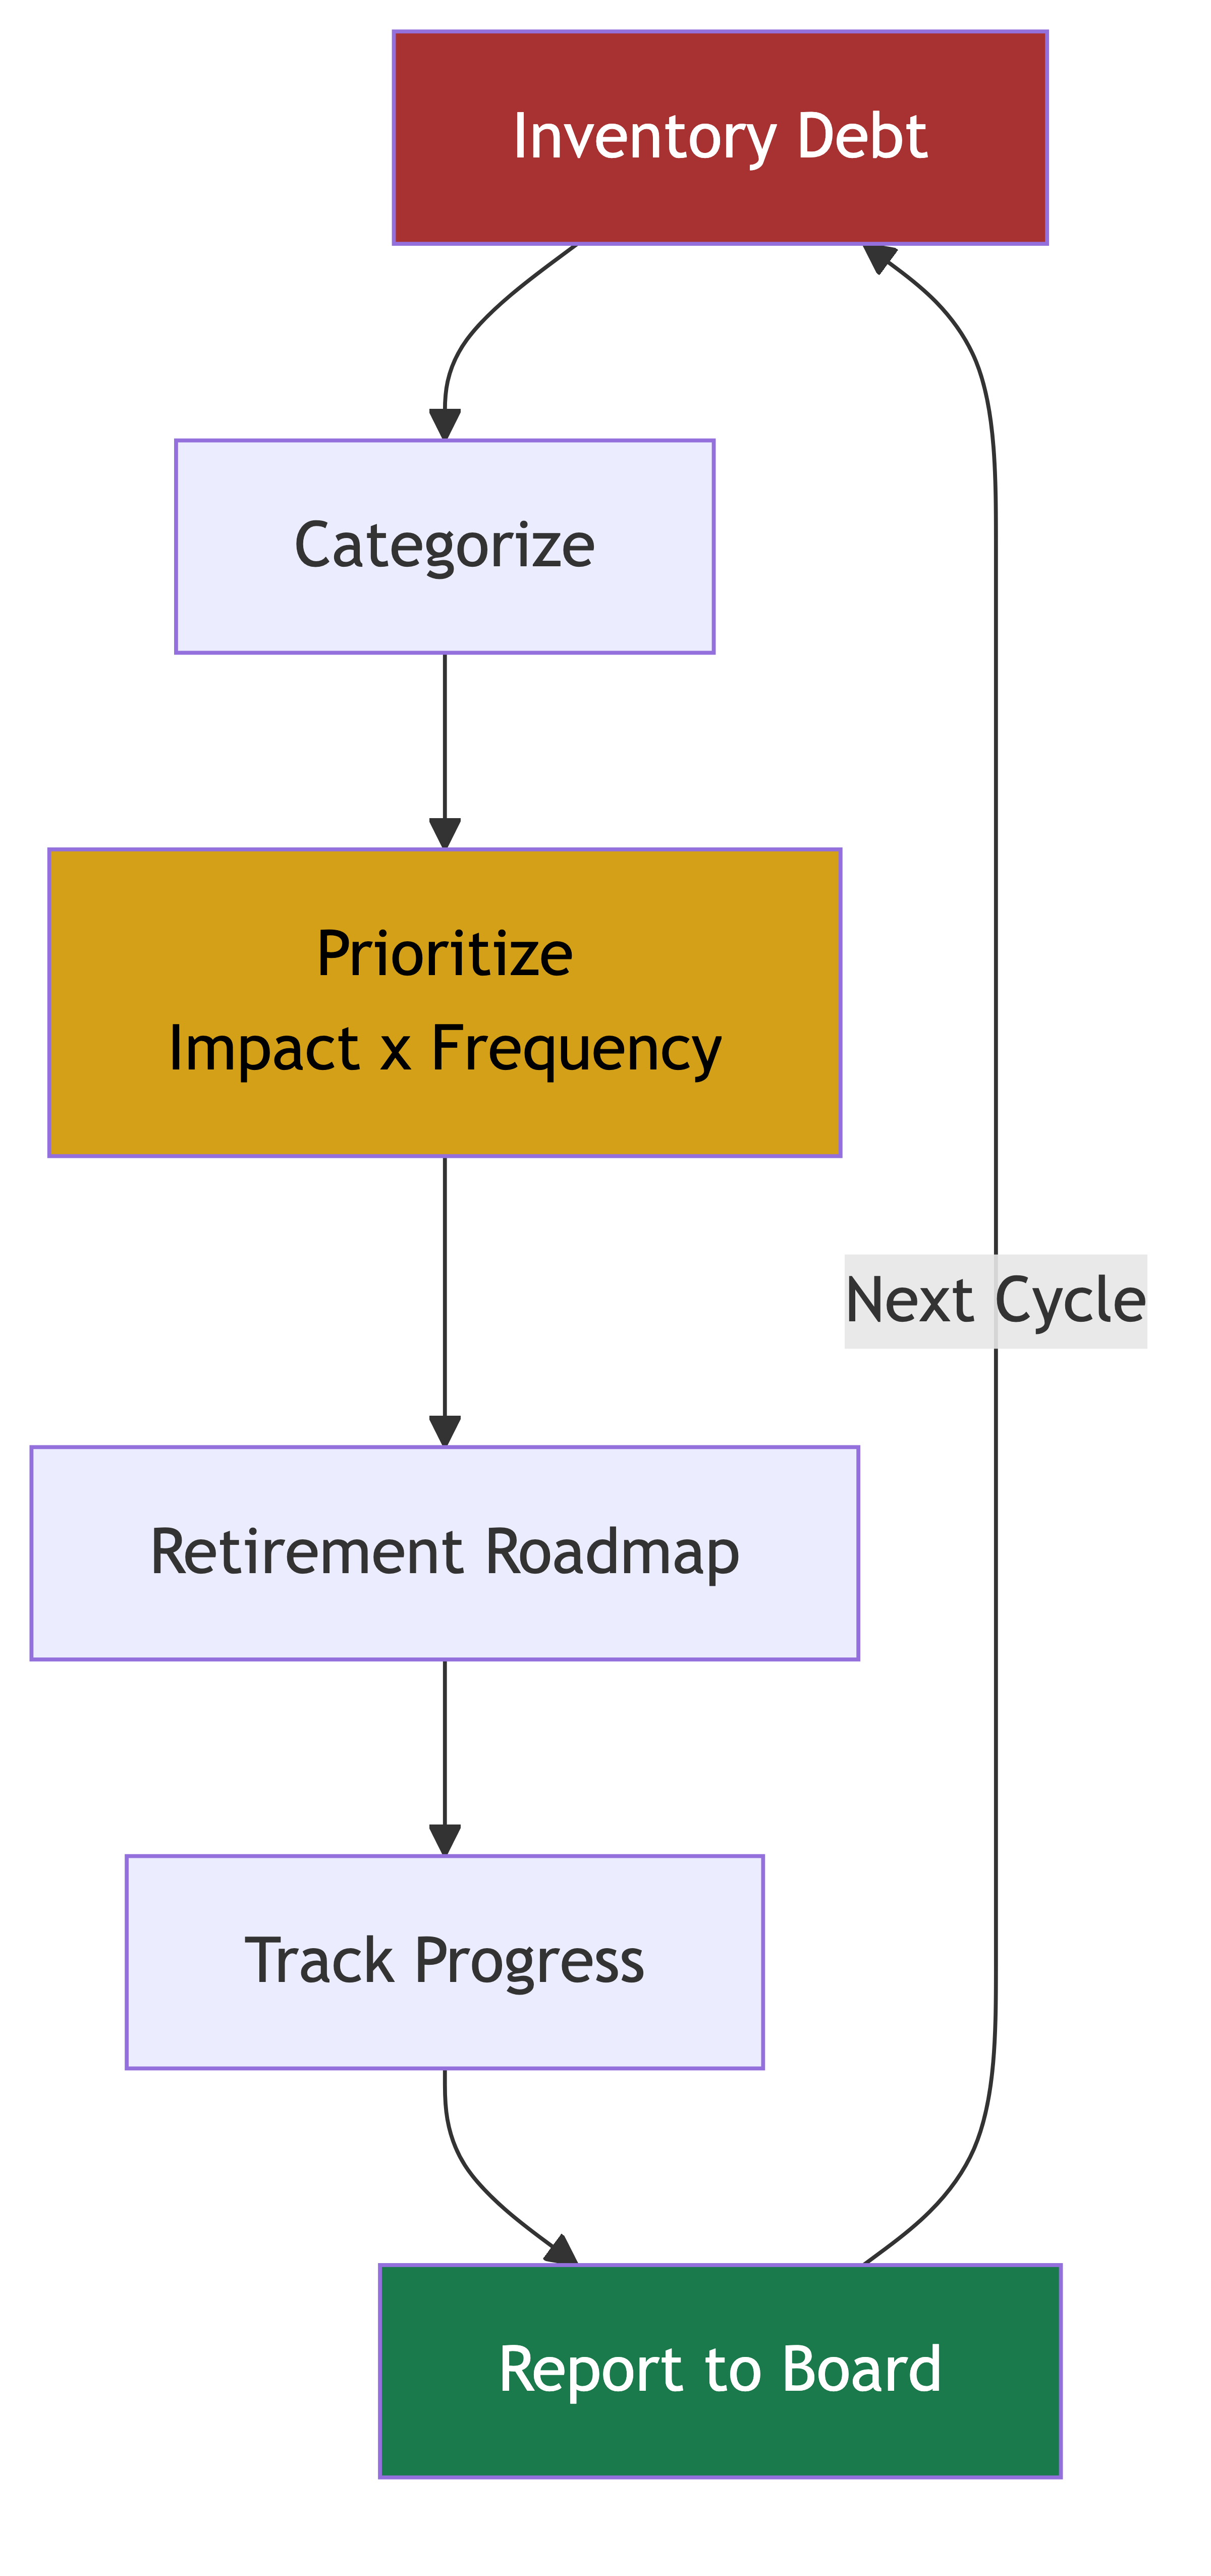
Why This Matters at the CTO Level
Technical debt is the most poorly understood concept in engineering management. Engineers use it as a catch-all complaint. Product managers treat it as an excuse to avoid delivering features. Executives dismiss it as engineering gold-plating. And almost nobody actually manages it as what it is: a strategic liability that compounds over time and eventually threatens the business.
Here's the analogy that works best with business leaders, because it's more than an analogy — it's literally how technical debt functions: debt compounds like interest. A shortcut taken today doesn't just create a one-time cost. It slows down every future change that touches the affected code. It increases the risk of every deployment. It makes onboarding slower, debugging harder, and testing less reliable. And as more shortcuts accumulate around the first one, the compounding accelerates.
I've seen companies where technical debt consumed 60-70% of engineering capacity. Not because anyone decided to stop building features, but because years of accumulated shortcuts made everything take three to five times longer than it should. New features that should take a week took a month. Bug fixes that should take an hour took a day. The business blamed engineering for being slow, engineering blamed the business for never allowing time to clean up — and both were right.
As CTO, your job is to break this cycle. Not by eliminating all technical debt — that's neither possible nor desirable — but by managing it strategically: measuring it, making it visible, prioritizing its paydown, and balancing it against feature delivery at the organizational level.
Org-Wide Tech Debt Inventory
You can't manage what you can't see. The first step in any technical debt strategy is understanding what debt you actually have, where it lives, and what it's costing you.
Categorizing Technical Debt
Not all debt is created equal. A useful categorization:
Code debt. Code that's hard to understand, hard to change, or hard to test. Duplicated logic, missing abstractions, tangled dependencies, dead code. This is the most common type and the one engineers complain about most.
Architecture debt. System designs that no longer fit current requirements. A monolith that should be decomposed. A synchronous system that needs to be asynchronous. A single-region deployment that needs to be multi-region. Architecture debt is less common but much more expensive to address.
Infrastructure debt. Outdated operating systems, end-of-life databases, unsupported libraries, manually provisioned infrastructure. This debt has a nasty property: it doesn't just slow you down, it creates security vulnerabilities and compliance risks.
Test debt. Missing tests, unreliable tests, slow test suites. Test debt doesn't slow you down directly, but it makes every other kind of change riskier and more expensive by removing the safety net.
Documentation debt. Missing or outdated documentation, undocumented tribal knowledge, misleading comments. This debt multiplies the cost of onboarding and the cost of working on unfamiliar parts of the codebase.
Process debt. Manual steps that should be automated, approval processes that add delay without adding value, deployment procedures that require specialized knowledge. This is the debt that's most visible to developers day-to-day.
Dependency debt. Libraries and frameworks that are multiple major versions behind, creating a growing gap that gets harder to close with each passing version. This is the debt that creates security vulnerabilities when critical patches are only available for newer versions.
Building the Inventory
A practical approach to inventorying tech debt across the organization:
Step 1: Survey engineering teams. Ask each team to list their top 5 technical debt items, with estimated impact (how much time does this cost us per week/month?) and estimated remediation effort (how long would it take to fix?).
Step 2: Analyze incident data. What systems cause the most incidents? What code paths are involved in the most bugs? Where are engineers spending the most time on unplanned work? High-incident areas often have high debt.
Step 3: Review architecture for known anti-patterns. Are there tightly coupled systems that should be decoupled? Are there single points of failure? Are there scalability bottlenecks? Architecture debt often hides in plain sight.
Step 4: Audit dependencies. How many dependencies are more than one major version behind? How many are using end-of-life runtimes or frameworks? Automated tools (Dependabot, Renovate, Snyk) can help identify these.
Step 5: Measure velocity trends. If feature delivery velocity is declining over time despite stable team size, that's a strong signal that technical debt is accumulating faster than it's being paid down.
Maintaining the Inventory
A one-time inventory is useful, but technical debt is dynamic. New debt is created constantly (and that's sometimes intentional and appropriate). You need an ongoing process:
- Quarterly review: Each team updates their top debt items and estimates
- Incident-driven additions: When an incident reveals debt, add it to the inventory
- Architecture review additions: When architectural reviews identify debt, add it to the inventory
- Retirement tracking: When debt is paid down, remove it and track the improvement
Prioritization Framework
Having an inventory is step one. Step two is deciding what to fix first. You'll never have enough capacity to address all debt simultaneously, so prioritization is critical.
The Impact-Effort Matrix (With a Twist)
The classic 2x2 matrix of impact vs. effort is a starting point, but for technical debt you need a third dimension: risk.
Impact: How much does this debt cost the organization? Measured in:
- Engineering hours wasted per month
- Incidents caused per quarter
- Customer impact (latency, errors, downtime)
- Blocked capabilities (things we can't build because of this debt)
Effort: How much work would it take to address this debt? Measured in:
- Engineering weeks or months
- Number of teams involved
- Migration complexity
- Risk of the remediation itself (some debt paydown is high-risk)
Risk: What's the probability that this debt causes a serious problem if left unaddressed?
- Security vulnerabilities in outdated dependencies
- End-of-life systems without vendor support
- Scalability limits approaching with growth projections
- Compliance risks from non-conforming infrastructure
Prioritization Categories
Based on these dimensions, categorize debt into four groups:
Fix now. High impact, low effort, or high risk. These are your quick wins and your urgent risks. A security vulnerability in an outdated library. A configuration error that causes periodic outages. Fix these immediately.
Plan and schedule. High impact, high effort. These are your strategic debt paydown projects. A monolith decomposition. A database migration. A major framework upgrade. These need dedicated capacity, clear milestones, and executive sponsorship.
Opportunistic. Low impact, low effort. Fix these when you're already working in the area. Don't schedule dedicated time, but don't ignore them either. A boy-scout rule ("leave the code cleaner than you found it") works well for this category.
Accept and monitor. Low impact, high effort. Some debt isn't worth fixing right now. Acknowledge it, document the rationale for deferring, and monitor it. If impact increases (e.g., you're now working in this code more frequently), recategorize.
Decision Criteria for Major Debt Projects
For large debt paydown projects (those requiring dedicated teams and months of effort), apply additional criteria:
- What's the cost of delay? Will this debt get cheaper or more expensive to address over time? Dependency upgrades typically get harder the longer you wait. Architecture changes have a more stable cost.
- What's the opportunity cost? What features won't get built while this debt is being addressed? Is the debt paydown worth more than those features?
- What's the risk of remediation? Major refactoring and migration projects carry their own risks. A botched database migration could cause an outage. A poorly planned monolith decomposition could introduce new bugs. Factor in the risk of the fix itself.
- Are there dependencies? Does this debt block other work? If three teams are waiting on a platform upgrade before they can build their features, the platform upgrade gets priority.
Debt Retirement Roadmap
A debt retirement roadmap translates your prioritized inventory into a concrete plan with timelines, milestones, and resource allocation.
Allocating Capacity for Debt Paydown
The perennial question: how much engineering capacity should go to debt paydown vs. feature development?
There's no universal right answer, but here are guidelines:
20% baseline. Allocate roughly 20% of engineering capacity to ongoing debt paydown, infrastructure improvements, and reliability work. This is the "maintenance" level that prevents debt from accumulating faster than you can address it.
Dedicated sprints or teams for major projects. For large debt projects (major migrations, architecture changes), allocate dedicated teams or time blocks rather than trying to squeeze debt work into feature sprints. Half-hearted debt paydown takes twice as long and produces half the results.
Debt emergencies. Sometimes debt reaches a crisis point — a dependency reaches end-of-life, a scalability limit is approaching, or a security vulnerability requires immediate attention. These need to be handled like any other emergency: drop what you're doing and fix it.
Roadmap Structure
Organize the roadmap into time horizons:
This quarter (committed):
- Specific debt items to address
- Teams assigned
- Milestones and checkpoints
- Success criteria
Next quarter (planned):
- Debt items tentatively scheduled
- Capacity allocated but not yet assigned
- Dependencies identified
This year (directional):
- Major debt themes to address
- Rough capacity allocation
- Strategic alignment
The Strangler Fig Pattern
For large-scale debt retirement (replacing legacy systems, decomposing monoliths), the strangler fig pattern is your friend. Instead of rewriting the old system from scratch (which almost always fails), gradually build the new system alongside the old one, routing traffic to the new system piece by piece.
This approach:
- Delivers value incrementally (each migrated component is an improvement)
- Reduces risk (the old system is still there as a fallback)
- Allows you to learn and adjust as you go
- Keeps the business running during the transition
The alternative — the "big bang" rewrite — has a dismal track record. It takes longer than expected, introduces unexpected bugs, and often gets cancelled halfway through because the business can't afford to wait.
Debt Compounds Like Interest
This is the mental model that makes technical debt real for non-technical stakeholders. Let me walk through how the compounding actually works.
How Compounding Manifests
Year 1: You take a shortcut. Instead of building a proper abstraction, you duplicate some code. Cost: negligible. Time saved: two days.
Year 2: Three other features are built on top of the duplicated code. Each one makes slightly different assumptions. Changing the underlying behavior now requires changing four places instead of one. Cost: an extra day of work on every change that touches this area. That's roughly 10 extra days per year.
Year 3: A bug is found in the duplicated logic. It's fixed in two of the four places but missed in the other two. A customer-facing incident results. Cost: the incident itself (customer trust, engineering time to diagnose) plus another day to find and fix all the copies. The duplicated code has now been modified differently in different places, making future changes even harder.
Year 4: A new engineer is onboarded and encounters this code. They spend two days trying to understand why the same logic exists in four places with subtle differences. They ask a senior engineer, who spends an hour explaining the history. Multiply this by every new hire. Cost: two days of onboarding time per new hire, plus ongoing cognitive load for everyone working in this area.
Year 5: A major feature needs to change the underlying behavior. Because of the accumulated duplication and divergence, what should be a one-week project takes six weeks. The product team is frustrated by the delay. Engineering is frustrated by the code quality. Both blame the other.
That original two-day shortcut has now cost the organization months of productivity and at least one customer-facing incident. That's compounding.
The Debt Spiral
The most dangerous form of compounding is the debt spiral: debt slows you down, which creates pressure to take more shortcuts, which creates more debt, which slows you down further.
Here's how it plays out:
- Business pressure demands faster delivery
- Teams take shortcuts to meet deadlines
- Shortcuts create technical debt
- Technical debt slows future development
- Business pressure increases because things are slower
- Teams take more shortcuts
- Repeat
Breaking this spiral requires executive-level intervention. The CTO needs to create protected capacity for debt paydown that is not subject to feature pressure. If debt paydown capacity can be raided whenever a feature deadline looms, the spiral will continue.
Making Debt Visible to the Board
Technical debt is invisible to non-technical leaders unless you make it visible. And if it's invisible, it won't get resources.
Translating Debt to Business Impact
The board doesn't care about code quality. They care about:
- Time to market: "Technical debt is adding approximately 30% to our feature delivery timelines. Features that should take 4 weeks are taking 6 weeks."
- Incident frequency: "40% of our production incidents in the last quarter were caused by known technical debt items."
- Engineering cost: "We're spending approximately 35% of our engineering budget on debt-related work — unplanned maintenance, incident response, and working around limitations."
- Competitive risk: "Our primary competitor ships features 2x faster than we do. Our analysis suggests that technical debt accounts for most of that gap."
- Talent risk: "Our exit interview data shows that frustration with code quality and technical debt is the second most common reason engineers leave."
Visualization
Create a simple, visual representation of technical debt that can be included in board materials:
The debt-to-velocity ratio. Track the ratio of time spent on debt-related work versus feature work over time. If it's trending in the wrong direction, that's a clear and concerning signal.
The incident attribution chart. For each production incident, tag whether technical debt was a contributing factor. Show the trend over time.
The delivery speed trend. Track average time to deliver a standard-sized feature over time. If it's increasing despite stable team size, debt is the most likely culprit.
The debt burn-down chart. Similar to a sprint burndown, but for your tech debt inventory. Show how much debt has been retired, how much has been added, and the net trend.
The Investment Framing
Frame debt paydown as investment, not cost:
"We have an estimated 1.5M over six months in targeted debt paydown, which we project will recover $1M annually in engineering productivity going forward."
This is the language boards understand: invest X, return Y, timeline Z.
Balancing Debt Paydown with Feature Delivery at the Org Level
This is the hardest part of technical debt strategy. Every hour spent on debt paydown is an hour not spent on features. Every hour spent on features potentially adds more debt. Getting this balance right is one of the CTO's most important judgment calls.
Framework for Balance
Understand the current ratio. What percentage of engineering time goes to debt-related work today? If teams are already spending 40% of their time on debt (through incidents, workarounds, and maintenance), then allocating dedicated debt paydown capacity isn't taking away from feature work — it's investing in future feature velocity.
Set explicit targets. "We will allocate 20% of engineering capacity to debt paydown this quarter." Make it explicit, make it tracked, and protect it from encroachment. If the target is vague ("try to address some debt"), it will always lose to feature pressure.
Use economic reasoning. For any given quarter, compare the options:
- Option A: 100% features. Ship 10 features, but velocity continues to decline.
- Option B: 80% features, 20% debt paydown. Ship 8 features, but velocity stabilizes and begins to recover.
- Option C: 60% features, 40% debt paydown. Ship 6 features, but velocity significantly improves.
Over a 12-month horizon, Option B or C often delivers more total features than Option A because of the compounding effect of improved velocity.
Different balance for different teams. Not all teams carry the same debt burden. A team with heavy legacy code might need 40% debt allocation. A team on a greenfield project might need 10%. One size doesn't fit all.
The Feature Tax Model
One approach that works well is the "feature tax." For every major feature delivered, require that a proportional amount of debt paydown is included. If a team ships a new feature in a legacy codebase, they also improve the surrounding code quality. This prevents new features from accumulating on top of existing debt without addressing it.
This doesn't work for all types of debt — you can't pay down a major architecture problem one feature at a time. But for code-level debt and test debt, the feature tax is an effective and sustainable approach.
When to Prioritize Debt Over Features
There are specific situations where debt should take priority over feature delivery:
- Security debt: When outdated systems create security vulnerabilities that could lead to breaches
- Scalability limits approaching: When your systems will hit capacity limits within the next growth cycle
- End-of-life dependencies: When critical dependencies lose vendor support
- Velocity has degraded to crisis levels: When teams are spending more time on debt-related work than feature work
- Major platform migration: When the cost of delay is increasing rapidly (e.g., an impending license change or API deprecation)
When to Accept More Debt
Sometimes taking on more debt is the right strategic choice:
- Market windows: A competitive opportunity that will close if you don't move fast
- Survival mode: When the company needs revenue now or it won't be around to pay down debt later
- Prototype validation: When you're testing a hypothesis and don't know if the feature will survive
- Temporary systems: When you're building something with a known, short lifespan
The key is making these decisions consciously and tracking the debt incurred. "We're taking this shortcut to hit the launch window, and we're adding the remediation to next quarter's debt roadmap."
Measuring the Cost of Debt
Measuring the cost of technical debt is notoriously difficult, but approximate measures are much better than no measures.
Direct Cost Metrics
Incident cost. For incidents attributed to technical debt, calculate the total cost: engineering hours spent on response, customer impact (revenue lost, SLA credits), and follow-up remediation.
Rework rate. What percentage of engineering time is spent on rework — fixing bugs, addressing incidents, maintaining legacy systems? Track this by team and over time.
Change amplification. How many files, services, or systems need to be modified for a typical change? High change amplification suggests tight coupling and duplicated logic — common debt symptoms.
Cycle time inflation. Compare the time to deliver features now versus 6 or 12 months ago. If cycle time is increasing with stable team size, debt is a likely contributor.
Proxy Metrics
Test coverage trends. Declining test coverage correlates with accumulating test debt.
Dependency freshness. How many versions behind are your dependencies? This measures dependency debt directly.
Code churn concentration. If the same files are being modified repeatedly (high churn), they may be carrying significant code debt.
Onboarding time. If new engineers take longer to become productive over time, that suggests accumulating documentation debt and code complexity.
Real-World Examples
Example 1: The Monolith That Ate the Company
A fintech company built their product as a monolith. It worked great at 10 engineers. At 50 engineers, deployments took all day and caused cascading failures weekly. At 100 engineers, teams were stepping on each other constantly, and the deploy cycle had slowed to once a week. Feature velocity dropped 70% over two years despite the team tripling in size.
The CTO proposed a decomposition project. The board initially resisted — "Why are we spending money on something that doesn't add features?" The CTO reframed: "Our engineering team has tripled in size, but output has decreased by 30%. At current trajectory, adding engineers actually makes us slower. The monolith is the bottleneck."
The decomposition took 18 months (using the strangler fig pattern) and required 15% of engineering capacity. After completion, feature delivery velocity per team increased 4x, deploy frequency went from weekly to multiple times daily, and incident frequency dropped 65%.
The board member who had initially resisted later said it was the most important technology investment the company had made.
Example 2: The Dependency Time Bomb
A SaaS company had been running on an end-of-life version of their web framework for three years. Engineers had been raising the issue, but there was always a more pressing feature to build. The framework was four major versions behind, and the upgrade path was increasingly complex.
When a critical security vulnerability was discovered in their framework version, the only fix was upgrading to a supported version. But the four-version gap meant the upgrade was a three-month emergency project that required freezing all feature development.
Three months of zero feature delivery. Hundreds of thousands in lost revenue from delayed product improvements. All because the incremental cost of upgrading one version at a time (roughly two weeks per version) was repeatedly deferred.
Lesson: small, regular debt payments are far cheaper than emergency debt restructuring.
Example 3: The Debt Budget That Transformed Engineering Culture
A CTO implemented a "debt budget" — each quarter, every team was allocated 20% of their capacity for debt paydown, tracked separately from feature work. Teams had autonomy to spend their debt budget however they chose, but they had to report what they spent it on and what the impact was.
Within two quarters, several things happened:
- Teams started proactively identifying and tracking debt instead of just complaining about it
- Cross-team debt projects emerged (teams independently identified the same shared debt and proposed joint solutions)
- Feature velocity increased despite 20% less capacity allocated to features
- Engineer satisfaction scores increased significantly
The most surprising result: teams actually started spending less than their debt budget within a year, because the initial burst of paydown addressed the most impactful items. The steady-state allocation settled at around 15%.
Common Mistakes
Mistake 1: The Big Bang Rewrite
Proposing to rewrite a major system from scratch instead of incrementally improving it. Big bang rewrites take 2-3x longer than estimated, introduce new bugs while trying to preserve existing behavior, and often get cancelled partway through. Use the strangler fig pattern instead.
Mistake 2: Invisible Debt
Not tracking or measuring technical debt, making it impossible to manage strategically. If debt is invisible, it will accumulate until it reaches crisis levels. Make it visible through inventories, metrics, and regular reporting.
Mistake 3: Guilt-Driven Debt Paydown
Addressing debt only when engineers feel guilty about code quality, without strategic prioritization. This leads to polishing code that doesn't matter while ignoring debt that's actually causing problems. Prioritize by business impact, not by engineering aesthetics.
Mistake 4: Zero-Debt Aspirations
Believing that the goal is to eliminate all technical debt. Some debt is intentional and appropriate. The goal is to manage debt at a sustainable level where it doesn't significantly impair velocity or increase risk. Zero debt would require never taking shortcuts, which would mean never moving fast.
Mistake 5: No Protected Capacity
Allocating debt paydown capacity in theory but allowing it to be raided for feature work in practice. If debt capacity isn't protected — meaning it can't be taken away without CTO-level approval — it will always lose to feature pressure.
Mistake 6: Paying Down the Wrong Debt
Prioritizing debt that engineers find personally annoying over debt that has the highest business impact. A messy module that nobody touches is less important than a fragile API that causes weekly incidents. Prioritize by impact, not by aesthetics.
Mistake 7: Not Tracking Debt Creation
Focusing on paying down debt without addressing the rate at which new debt is created. If you're creating debt faster than you're paying it down, you're losing. Track both sides of the ledger.
Business Value
Technical debt strategy is ultimately about protecting and improving engineering throughput — the engine that drives your entire business. Here's how to connect it to business outcomes:
Velocity recovery. If technical debt is reducing engineering throughput by 25%, and you spend 1.25M in engineering capacity per year, every year going forward. That's a payback period of about 14 months, with returns that compound as the recovered velocity enables faster feature delivery.
Risk reduction. Technical debt creates operational risk (incidents), security risk (outdated dependencies), and strategic risk (inability to pivot quickly). Quantify the expected cost of these risks and show how debt paydown reduces them.
Talent retention. Engineers leave organizations with high technical debt. If debt paydown improves retention by even a few engineers per year, the savings in recruiting and onboarding costs ($50-100K per hire) directly offset the investment.
Scalability. Technical debt limits your ability to scale — both the systems and the team. If you can't add engineers and get proportional output because of debt, that's a direct constraint on growth.
Competitive speed. In a market where speed matters, the company with less technical debt ships faster. If your competitor can deliver a feature in two weeks and you need six weeks because of debt, that's a competitive disadvantage that compounds over time.
When presenting technical debt strategy to the board, lead with the financial model: "Our current technical debt burden costs approximately Y million to reduce this burden by Z%, generating an expected return of $W million annually within 18 months."
The CTO who manages technical debt strategically — treating it as a financial liability, measuring its cost, and systematically paying it down while making conscious decisions about when to incur new debt — runs an engineering organization that gets faster over time. The CTO who ignores debt runs an organization that gets slower. The board can see the difference in the velocity trend line, even if they never look at a single line of code.
Common Pitfalls
-
Attempting a big bang rewrite instead of incremental improvement. Rewriting a major system from scratch takes two to three times longer than estimated, introduces new bugs, and often gets cancelled halfway through. The strangler fig pattern is almost always the better approach.
-
Prioritizing debt by engineering aesthetics instead of business impact. Polishing a messy module that nobody touches while ignoring a fragile API that causes weekly incidents misallocates scarce capacity. Always prioritize by measurable impact.
-
Allocating debt paydown capacity in theory but raiding it for features in practice. If debt capacity is not explicitly protected at the CTO level, it will always lose to feature pressure, and the debt spiral will continue.
-
Keeping debt invisible to non-technical stakeholders. If the board and executive team cannot see the cost of technical debt in terms of delivery speed, incident frequency, and engineering spend, they will never approve resources to address it.
-
Aspiring to eliminate all debt. Some debt is intentional and appropriate. The goal is to manage debt at a sustainable level, not to reach zero. Zero debt would require never taking shortcuts, which means never moving fast enough to compete.
-
Tracking debt paydown without tracking debt creation. Focusing only on retiring existing debt while ignoring the rate of new debt creation means you may be losing ground even as you invest in remediation.
Key Takeaways
-
Technical debt compounds like financial interest. A small shortcut today creates escalating costs through duplicated effort, incidents, slower onboarding, and reduced velocity over subsequent years.
-
Build an org-wide debt inventory by surveying teams, analyzing incident data, reviewing architecture, auditing dependencies, and measuring velocity trends. Maintain it through quarterly reviews.
-
Prioritize debt using three dimensions: impact (cost to the organization), effort (work to remediate), and risk (probability of causing a serious problem if left unaddressed).
-
Allocate roughly 20% of engineering capacity as a baseline for debt paydown. Use dedicated teams or time blocks for major debt projects rather than trying to squeeze them into feature sprints.
-
The debt spiral (pressure to go faster leads to shortcuts, which create debt, which slows everything down, which increases pressure) requires executive-level intervention to break.
-
Make debt visible to the board through the debt-to-velocity ratio, incident attribution charts, delivery speed trends, and debt burn-down charts. Frame paydown as investment with quantifiable return.
-
Consciously decide when to take on new debt (market windows, survival mode, prototype validation) and always document the decision and add remediation to the roadmap.