
Engineering Metrics
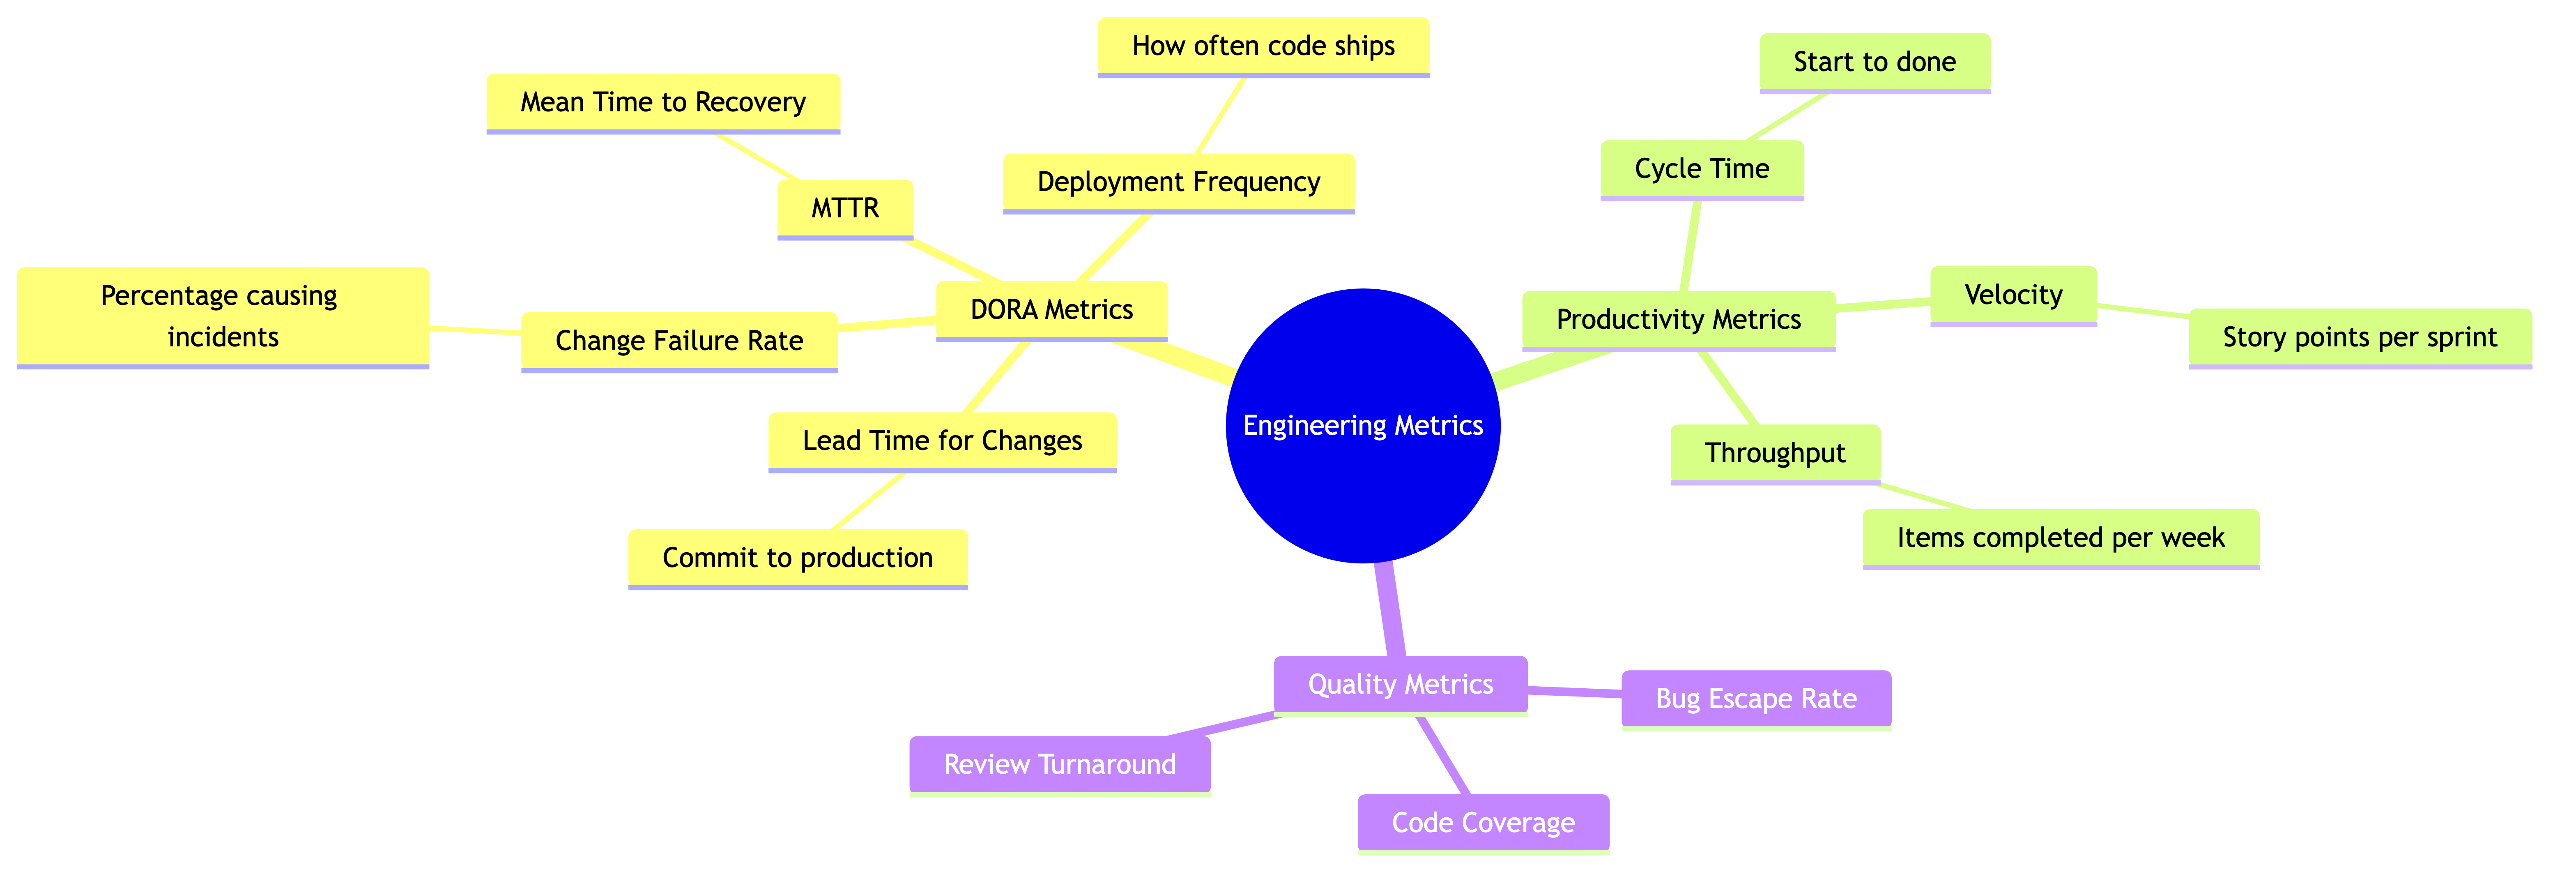
Business Value
Before we get into the specifics, let's be clear about why this matters to the business:
- Data-driven improvement — Without metrics, your improvement efforts are guesswork. With them, you can identify the highest-leverage changes and prove they worked.
- Bottleneck elimination — Metrics shine a light on where work gets stuck. Removing a single bottleneck can double your team's throughput without adding a single person.
- Delivery predictability — Leadership doesn't need you to go faster. They need to know when things will be done. Good metrics give you the data to make reliable forecasts.
- Executive confidence — When you can show trends, explain tradeoffs with data, and demonstrate continuous improvement, you earn trust. Trust buys you autonomy.
1. Why Measure
You can't improve what you don't measure. But here's the part people forget: you can destroy what you measure badly.
Metrics are a tool, not a weapon. The moment you use a metric to punish someone, you've guaranteed that metric will be gamed into uselessness. The moment you stop looking at metrics entirely, you're flying blind.
The right mindset is this: metrics are a flashlight. They help you see what's happening in your system. They don't tell you why something is happening, and they definitely don't tell you who to blame. You still need to go talk to people, observe the work, and use your judgment.
Good metrics have a few properties:
- They measure the system, not individuals
- They're hard to game without actually improving
- They lead to action — if a metric moves and you wouldn't do anything differently, stop tracking it
- They're understood by everyone on the team, not just you
A useful question before adding any metric: "If this number goes up (or down), what would I do about it?" If you can't answer that, you don't need that metric.
2. DORA Metrics
DORA (DevOps Research and Assessment) spent years studying thousands of engineering organizations to find which metrics actually predict software delivery performance. They landed on four.
Deployment Frequency
How often your team deploys to production.
This is a proxy for batch size. Teams that deploy frequently are shipping small changes. Small changes are easier to review, easier to test, easier to roll back. High deployment frequency is both a cause and a consequence of good engineering practices.
Lead Time for Changes
How long from code commit to code running in production.
This captures your entire delivery pipeline: code review, CI, staging, deployment. A long lead time means there's friction somewhere in the pipeline. Maybe your CI takes 45 minutes. Maybe PRs sit in review for two days. Maybe deployments only happen on Tuesdays.
Change Failure Rate
What percentage of deployments cause a failure in production (requiring a rollback, hotfix, or patch).
This is your quality signal. A team that deploys 50 times a day but breaks production on 30% of those deploys has a problem. The goal is to deploy frequently and safely.
Mean Time to Recovery (MTTR)
When something does break, how long does it take to restore service?
This is often more important than preventing all failures. Failures will happen. The question is whether you can detect them in minutes and fix them in minutes, or whether you find out from an angry customer tweet three hours later.
Industry Benchmarks
| Metric | Elite | High | Medium | Low |
|---|---|---|---|---|
| Deployment Frequency | On-demand (multiple/day) | Weekly to monthly | Monthly to every 6 months | Less than every 6 months |
| Lead Time for Changes | Less than 1 hour | 1 day to 1 week | 1 month to 6 months | More than 6 months |
| Change Failure Rate | 0-15% | 16-30% | 16-30% | 16-30% (but with far worse recovery) |
| MTTR | Less than 1 hour | Less than 1 day | 1 day to 1 week | More than 6 months |
The thing that surprised the DORA researchers — and surprises a lot of people — is that speed and stability aren't tradeoffs. Elite performers are both faster and more stable. The practices that make you fast (small batches, automation, good testing) are the same ones that make you reliable.
3. Velocity
Velocity is the most misunderstood metric in software engineering.
What it actually measures: how many story points (or whatever unit) a team completes per sprint. It's a measure of team capacity relative to that team's own estimation scale.
What it does NOT measure: productivity, value delivered, code quality, or anything you can compare across teams.
Here's why cross-team comparison is meaningless: if Team A estimates a task at 3 points and Team B estimates the same task at 8 points, Team B isn't slower. They just use a different scale. Story points are an internal planning tool, not a universal currency.
How to use velocity well
- Look at the trend, not the absolute number. If your team's velocity has been 40, 42, 38, 41, 39 for the past five sprints, your capacity is roughly 40. If it suddenly drops to 25, something changed. That's worth investigating.
- Use it for sprint planning. "We tend to complete about 40 points per sprint, so let's not plan 60."
- Watch for artificial inflation. If leadership starts asking "why isn't velocity going up?", teams will just start inflating their estimates. Now your metric is useless and you've also undermined your planning tool.
The best thing you can do with velocity is treat it as boring. It's a planning input. That's it. The moment it becomes a performance target, it stops working.
4. Cycle Time
Cycle time measures the elapsed time from when work is started to when it's in production. This is different from lead time (which often includes time spent in the backlog before anyone touches it).
This is the most actionable metric for finding bottlenecks. When your cycle time is long, you can break it into stages and see exactly where the time goes.
A typical breakdown:
| Stage | Common Time | Where Time Is Wasted |
|---|---|---|
| Development | 1-3 days | Unclear requirements, context switching, too much WIP |
| Code Review | Hours to days | Reviewers are overloaded, PR is too large, timezone gaps |
| CI/Build | Minutes to hours | Flaky tests, slow builds, resource contention |
| Staging/QA | Hours to days | Manual testing, environment issues, waiting for sign-off |
| Deployment | Minutes to hours | Manual deploys, change approval boards, deployment windows |
In my experience, most teams think their bottleneck is in development. It almost never is. The time is usually being eaten by waiting — waiting for review, waiting for a staging environment, waiting for a deployment window, waiting for someone to approve something.
When you visualize cycle time by stage, those wait times become painfully obvious. And unlike "write code faster" (which isn't a real lever), "reduce PR review wait time from 2 days to 4 hours" is a concrete, achievable improvement.
5. Throughput
Throughput is simply how many work items your team completes per unit of time. Could be stories per sprint, PRs merged per week, features shipped per quarter — pick the unit that makes sense for your context.
On its own, throughput is moderately useful. Combined with cycle time, it tells the full story.
Think of it like a highway:
- Throughput = how many cars arrive at the destination per hour
- Cycle time = how long each car takes to make the trip
You can have high throughput with long cycle time (lots of work in progress, all moving slowly). You can have low throughput with short cycle time (very few things in flight, but each one moves quickly). The healthy state is high throughput and short cycle time, which means things are flowing smoothly without too much WIP.
If throughput drops but cycle time stays the same, you probably have fewer people working (vacation, turnover, reassignment). If throughput drops and cycle time increases, you've got a bottleneck or too much work in progress. If throughput increases but cycle time also increases, you're probably just piling more WIP into the system, which will eventually collapse.
Little's Law makes this relationship precise: WIP = Throughput x Cycle Time. If you want to reduce cycle time without reducing throughput, you need to reduce WIP. This is counterintuitive for most managers, but it works every time.
6. Quality Metrics
Speed without quality is just creating future work. Here are the quality metrics that actually matter.
Bug Escape Rate
What percentage of bugs are found by customers rather than caught before production? If your QA process catches 90 bugs and customers find 10, your escape rate is 10%. Track this over time. If it's climbing, your testing isn't keeping up with your shipping pace.
Defect Density
Number of defects per unit of code (often per thousand lines). Useful for identifying which areas of your codebase are problematic. If one service has 5x the defect density of others, that's a signal it needs refactoring, better tests, or both.
Incidents per Deploy
How many production incidents are caused per deployment? This is closely related to DORA's change failure rate, but tracked at a more granular level. If you deploy 20 times a week and cause 1 incident, that's a 5% incident rate. Not bad. If you deploy twice a week and cause 1 incident, that's 50%. Very different story.
Balancing Speed and Quality
The trap is treating speed and quality as a slider — move one up, the other goes down. In practice, the best teams are fast because they have quality practices. Good tests mean you can deploy with confidence. Clean code means changes are fast to make. Solid monitoring means you catch problems in minutes.
When someone says "we need to move faster, skip the tests," that's borrowing speed from the future. You'll pay it back with interest during the next production incident.
7. Using Metrics to Find Bottlenecks
This is where metrics earn their keep. The question isn't "how is the team doing?" — it's "where is work getting stuck?"
Common bottlenecks metrics reveal
Long PR review times. If your cycle time breakdown shows PRs sitting for 24-48 hours before getting reviewed, you've found a bottleneck. Solutions: smaller PRs, dedicated review time, pairing instead of async review, review SLAs.
Slow deployments. If it takes 3 hours from "merged to main" to "running in production," that's a deployment bottleneck. Solutions: automate the pipeline, remove manual gates, invest in infrastructure.
Too much WIP. If your team has 15 things in progress but only completes 5 per sprint, the WIP is too high. Things are getting started but not finished. Solution: set WIP limits. Stop starting, start finishing.
Environment contention. If cycle time spikes every time multiple teams need the staging environment, you've found a shared resource bottleneck. Solution: ephemeral environments, better environment management.
Meeting overload. If development time spikes on certain days, check whether those are meeting-heavy days. Developers need focused blocks. If they have 30-minute gaps between meetings, nothing meaningful gets done in those gaps.
The key principle: metrics point to the problem, not the person. If PR reviews are slow, the answer isn't "Bob is a slow reviewer." The answer is "our review process has a structural issue." Maybe Bob is reviewing too many PRs because he's the only one with context on that service. That's a knowledge distribution problem, not a Bob problem.
8. Metrics Without Gaming
Goodhart's Law: "When a measure becomes a target, it ceases to be a good measure."
This isn't theoretical. It happens constantly.
- Target lines of code written? People write verbose code and stop refactoring.
- Target number of PRs merged? People split trivial changes into separate PRs.
- Target velocity? People inflate estimates.
- Target number of bugs fixed? People log trivial bugs just to close them.
- Target deployment frequency? People deploy empty changes.
How to prevent gaming
Measure outcomes, not outputs. Instead of "number of features shipped," measure "customer adoption of shipped features." Instead of "bugs fixed," measure "customer-reported issues over time." Outcomes are much harder to game because they require actually delivering value.
Use multiple metrics together. If you only track speed, quality will suffer. If you track speed, quality, and customer satisfaction together, gaming one metric visibly hurts another. This creates natural balance.
Don't tie metrics to individual performance reviews. The moment a metric affects someone's compensation or promotion, they will optimize for the metric instead of the outcome. Use metrics to understand and improve the system. Evaluate individuals through code reviews, 1:1s, peer feedback, and the quality of their contributions.
Be transparent about why you're measuring. When the team understands that cycle time is tracked to find process bottlenecks (not to judge who's fast or slow), they'll engage with the data honestly. When they think it's surveillance, they'll game it.
Rotate what you focus on. If you've been focused on speed metrics for two quarters and the team has improved, shift focus to quality or reliability. This prevents any single metric from calcifying into a target.
9. Dashboards and Reporting
What to show leadership
Leadership needs a different view than what you track day-to-day. Their questions are:
- Are we getting better or worse over time?
- Can we predictably deliver what we've committed to?
- Are there risks I should know about?
A good leadership dashboard has 3-5 metrics, and every single one should tell a story they care about. Something like:
- Delivery predictability — What percentage of committed work was delivered on time?
- Deployment frequency trend — Are we improving our ability to ship?
- Change failure rate — Are we shipping safely?
- MTTR — When things break, how fast do we recover?
- Team health — A qualitative signal (from retros or surveys) that things aren't going off the rails
Show trends, not snapshots. A deployment frequency of 3/week means nothing without context. A chart showing it went from 1/month to 3/week over six months tells a story of improvement.
What you track internally
Internally, you can track more granular metrics because you're using them to find and fix specific problems:
- Cycle time broken down by stage
- PR review time and size distribution
- Flaky test rates
- WIP counts
- Build times
But don't put all of this on a dashboard. Most of these are investigative tools you pull up when something looks off, not things you stare at every day.
Keep it simple
The biggest dashboard mistake is putting 50 metrics on a screen and calling it "comprehensive." Nobody looks at 50 metrics. Nobody acts on 50 metrics. Pick the 3-5 that matter most right now, make them visible, and revisit the selection quarterly.
10. Real-World Examples
Scenario 1: The Hidden Bottleneck
A team was struggling with delivery speed. The engineering director assumed they needed to hire more developers. The EM started tracking cycle time by stage and discovered something surprising: development time averaged 2 days, but PR review time averaged 3.5 days. Code was sitting in review longer than it took to write.
The root cause: the team had an informal rule that the tech lead had to approve every PR. The tech lead was also doing feature work, attending architecture meetings, and handling escalations. PRs piled up.
The fix wasn't hiring. It was distributing review authority. They established a second reviewer for each service area and set a 24-hour review SLA. Cycle time dropped by 40% in one month. Zero new hires.
Scenario 2: The Gamed Metric
A VP decided that "story points completed per sprint" should be on the quarterly business review. They wanted to see it going up.
Teams responded rationally. They inflated estimates. A task that was 3 points became 5. A 5 became 8. Velocity charts looked fantastic — a beautiful upward trend. The VP was delighted.
Meanwhile, actual delivery didn't change. The same number of features shipped. The same number of customer requests were fulfilled. But the charts looked great, so nobody asked questions for two quarters.
When a new EM joined and started asking "why does velocity keep going up but our roadmap completion rate hasn't changed?", the house of cards fell apart. The fix was painful: they stopped reporting velocity to leadership entirely and replaced it with "roadmap items delivered vs. committed." This metric was tied to actual outcomes and couldn't be inflated by changing point scales.
Scenario 3: The Dashboard That Changed Everything
An engineering organization had a trust problem with the product team. Product felt that engineering was a black box — work went in, sometimes things came out, and nobody could explain the timing.
The EM team built a simple dashboard: committed vs. delivered items per quarter (with reasons for misses), average cycle time trend, and current WIP count.
Within two quarters, the narrative shifted. Product could see that when they added "urgent" items mid-sprint, cycle time went up and delivery went down. The data made the tradeoff visible. Instead of engineering saying "stop giving us unplanned work" (which sounds like complaining), the dashboard showed that each urgent insertion delayed 2-3 other items by an average of 4 days.
Product started being more disciplined about what was truly urgent. Engineering's predictability improved. Both teams started trusting each other more. The dashboard didn't solve the problem — it made the problem visible so the humans could solve it.
11. Common Mistakes
Measuring individuals, not teams
Software is a team sport. Measuring individual output (lines of code, commits, PRs) creates terrible incentives. The developer who spends a day helping three teammates get unblocked has produced enormous value but shipped zero code that day. Individual metrics would punish that person. Don't do it.
Too many metrics
If you track everything, you're effectively tracking nothing. Information overload leads to analysis paralysis. Pick a few metrics that connect to your current goals. You can always change them later.
Vanity metrics
Metrics that look good but don't drive decisions. "We deployed 847 times this quarter!" Okay, but were those meaningful deploys? Did they deliver value to customers? Vanity metrics make for nice slides but don't improve your engineering organization.
Using metrics to punish
"Your cycle time is the longest on the team." Congratulations, you've just ensured that person will cut corners on quality to bring their number down, and every other team member will avoid taking on complex work that might increase their cycle time. You've made everything worse.
Not acting on what metrics reveal
The only thing worse than not measuring is measuring, seeing a problem, and doing nothing about it. If your metrics show that deployments break production 25% of the time and you don't invest in testing or deployment safety, why are you measuring? Metrics without follow-through breed cynicism. The team will stop caring about the data if they see that leadership doesn't either.
Wrapping Up
Engineering metrics are powerful when used with the right intent: understanding your system, finding bottlenecks, and making improvements visible. They're destructive when used with the wrong intent: surveillance, punishment, or performance theater.
Start small. Pick 2-3 metrics that connect to a real problem your team is facing. Track them for a few months. Use them to make one concrete improvement. Then expand from there.
The best engineering organizations aren't the ones with the most sophisticated metrics dashboards. They're the ones where metrics lead to conversations, conversations lead to experiments, and experiments lead to genuine improvement. The numbers are a starting point, not the destination.
Common Pitfalls
- Measuring individuals instead of teams. Tracking individual output like lines of code or commits creates perverse incentives and punishes the engineers who spend time unblocking others, mentoring, and doing the collaborative work that makes teams effective.
- Using metrics as a weapon. The moment you use a metric to punish someone — "your cycle time is the longest on the team" — you guarantee that metric will be gamed into uselessness and that people will avoid complex work.
- Tracking too many metrics at once. Monitoring 50 metrics means effectively tracking nothing. Information overload leads to analysis paralysis. Pick 3-5 metrics tied to your current goals and revisit them quarterly.
- Reporting velocity to leadership as a success metric. Velocity is a team-internal planning tool, not a measure of value delivered. Presenting it upward invites pressure to inflate estimates, which destroys its usefulness for planning.
- Measuring and then not acting on what you find. Seeing a problem in the data and doing nothing about it breeds cynicism. The team will stop caring about metrics if they see that leadership does not act on them either.
- Tying metrics directly to individual performance reviews. When a metric affects someone's compensation or promotion, they will optimize for the metric instead of the outcome, creating Goodhart's Law problems across the team.
Key Takeaways
- Metrics are a flashlight for understanding your system, not a weapon for judging individuals. They should measure the system, be hard to game, lead to action, and be understood by the whole team.
- The four DORA metrics — deployment frequency, lead time for changes, change failure rate, and MTTR — are the most research-backed indicators of software delivery performance, and elite teams are both faster and more stable.
- Velocity is a planning input, not a performance target. The moment it becomes a target, it stops working. Treat it as boring and keep it internal.
- Cycle time broken down by stage is the most actionable metric for finding bottlenecks. Most team slowdowns come from waiting — for review, for environments, for approvals — not from slow coding.
- Quality metrics like bug escape rate, defect density, and incidents per deploy ensure that speed improvements do not come at the expense of reliability.
- Use multiple metrics together to create natural balance. Tracking only speed will sacrifice quality; tracking speed, quality, and customer satisfaction together prevents gaming.
- Leadership dashboards should have 3-5 metrics showing trends over time, not snapshots. Internal tracking can be more granular but should be investigative, not permanently displayed.
- The best metric culture is one where numbers lead to conversations, conversations lead to experiments, and experiments lead to genuine improvement.